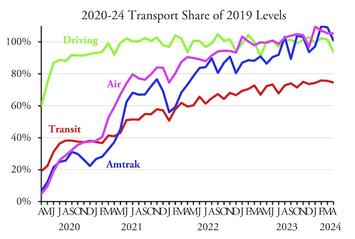
Transit systems carried less than 75 percent as many riders in April 2024 as in the same month before the pandemic, according to data released by the Federal Transit Administration last week. Transit ridership tends to be significantly greater on weekdays than weekends and holidays, but April had the same number of business days in both years. Ridership has been hovering between 73 to 76 percent for the last eight months and since March 2020 has never actually reached 76 percent of pre-pandemic levels.
Of the major modes, bus-rapid transit is doing best with 111 percent of 2019 riders, but that’s mainly because cities such as Houston, San Francisco, and Tampa opened BRT routes between 2019 and 2024. Conventional buses carried 80 percent of 2019 riders, light rail 74 percent, and heavy rail under 70 percent. Commuter trains carried 67 percent but commuter buses carried only 49 percent.
Of the nation’s largest urban areas, ridership was above average in Los Angeles (81%), Miami (90%), Dallas (80%), Houston (89%), Washington (81%), San Diego (93%), Tampa (86%), Las Vegas (84%), and Cleveland (77%). Ridership was below average in Chicago (66%), Philadelphia (67%), Atlanta (55%), Boston (67%), Detroit (70%), Phoenix (56%), San Francisco-Oakland (64%), Minneapolis-St. Paul (59%), Denver (63%), St. Louis (59%), Riverside-San Bernardino (66%), Portland (68%), and San Antonio (72%). Ridership was within 2 percent of average in New York (76%), Seattle (73%), and Baltimore (74%).
Some transit agencies are responding to lower ridership (and lower farebox revenues) by reducing service frequencies. But many of the larger agencies are seeking more subsidies to make up for lost riders.
New York’s MTA was counting on the city’s cordon pricing plan to supplement sagging fare revenues, but New York Governor Kathy Hochul indefinitely cancelled that plan plan. It is likely the governor did so due to the upcoming election and plans on restoring it after the election. In the meantime, Democrats in the state legislature are considering a payroll tax or spending general funds to support New York City transit. ()
The mayor of Washington DC has proposed to target="_blank" rel="noopener"increase sales taxes to fund Metro. A proposal to rescue San Francisco BART by increasing sales taxes and bridge tolls is on hold partly due to opposition from other Bay Area transit agencies. Boston’s MBTA is paying for transit by drawing down its savings, but that will only work for a few more months.
Few legislators have suggested that, since transit is only carrying three-quarters as many riders as before the pandemic, perhaps it should get no more than three-quarters (or whatever) of the subsidies. Subsidies per rider in 2022 were double the subsidies in 2019. While ridership has increased 25 percent since 2022, costs have also grown so subsidies today remain much greater than in 2019. Fewer people than ever depend on transit and, outside of New York City, transit plays an almost insignificant role in the nation’s transportation.
As usual, I’ve posted an enhanced version (20.5-MB) of the Federal Transit Adminitration’s spreadsheet. The FTA’s raw data are in cells A1 through JR2289. Annual totals from 2002 through 2023 are in columns JS through KO. Column KP compares April 2024 with April 2019. Column KQ compares 2024 to date with the same months of 2019.
National and mode totals are in rows 2290 through 2309. To show New York’s importance, row 2314 shows the percentage share of ridership that takes place in the New York urban area. Transit agency totals are in rows 2330 through 3319. Urban area totals are in rows 3321 through 3811. These enhancements are on the ridership (UPT for unlinked passenger trips) and service (VRM for vehicle-revenue-miles) worksheets. I hope you find this spreadsheet useful.
This piece first appeared at The Antiplanner.
Randal O'Toole, the Antiplanner, is a policy analyst with nearly 50 years of experience reviewing transportation and land-use plans and the author of The Best-Laid Plans: How Government Planning Harms Your Quality of Life, Your Pocketbook, and Your Future.
Graph: courtesy The Antiplanner.


commuters
Obviously the commuter transit modes are the most seriously and steadily down. If this reflects changed work patterns--and not simply auto trips taking their place--then resources should be shuffled. If it is auto trips, then parking charges may need to be adjusted.