Much attention has been given the increase in transit use in America. In context, the gains have been small, and very concentrated (see: No Fundamental Shift to Transit, Not Even a Shift). Much of the gain has been in the urban cores, which house only 14 percent of metropolitan area population. Virtually all of the urban core gain (99 percent) has been in the six metropolitan areas with transit legacy cities (New York, Chicago, Philadelphia, San Francisco, Boston, and Washington).
In recent articles, I have detailed a finer grained, more representative picture of urban cores, suburbs and exurbs than is possible with conventional jurisdictional (core city versus suburban) analysis. The articles published so far are indicated in the "City Sector Articles Note," below.
Transit Commuting in the Urban Core
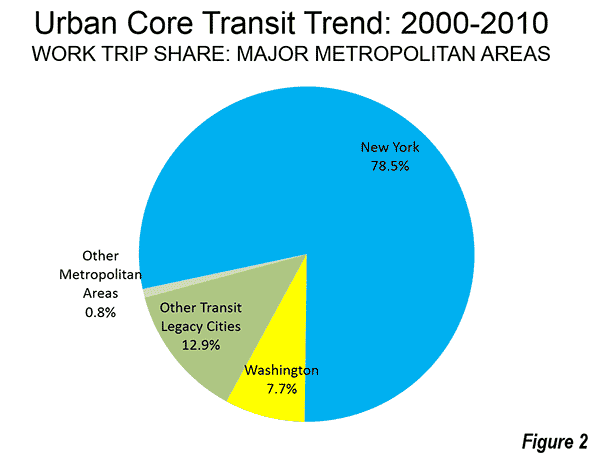
As is so often the case with transit statistics, recent urban cores trends are largely a New York story. New York accounted for nearly 80 percent of the increase in urban core transit commuting. New York and the other five metropolitan areas with "transit legacy cities" represented more than 99 percent of the increase in urban core transit commuting (Figure 1). This is not surprising, because the urban cores of these metropolitan areas developed during the heyday of transit dominance, and before broad automobile availability. Indeed, urban core transit commuting became even more concentrated over the past decade. The 99 percent of new commuting (600,000 one-way trips) by transit in the legacy city metropolitan areas was as well above their 88 percent of urban core transit commuting in 2000.
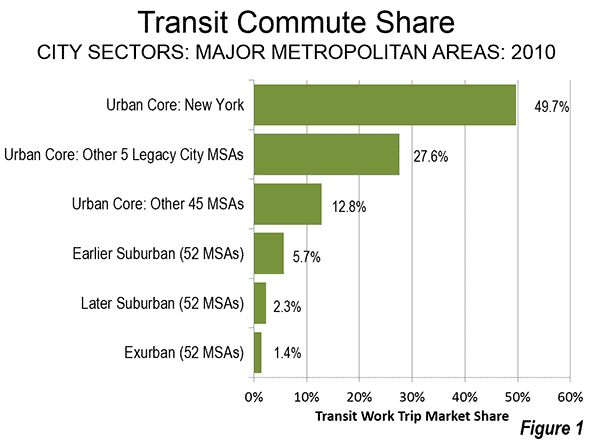
New York's transit commute share was 49.7 percent in 2010, well above the 27.6 percent posted by the other five metropolitan areas with transit legacy cities. The urban cores of the remaining 45 major metropolitan areas (those over 1,000,000 population) had a much lower combined transit work trip market share, at 12.8 percent.
The suburban and exurban areas, with 86 percent of the major metropolitan area population, had much lower transit commute shares. The Earlier Suburban areas (generally median house construction dates of 1946 to 1979, with significant automobile orientation) had a transit market share of 5.7 percent, the Later Suburban areas 2.3 percent and the Exurban areas 1.4 percent (Figure 2).
The 2000s were indeed a relatively good decade for transit, after nearly 50 years that saw its ridership (passenger miles) drop by nearly three-quarters to its 1992 nadir. Since that time, transit has recovered 20 percent of its loss. Transit commuting has always been the strongest in urban cores, because the intense concentration of destinations in the larger downtown areas (central business districts) that can be effectively served by transit, unlike the dispersed patterns that exist in the much larger parts of metropolitan areas that are suburban or exurban. Transit's share of work trips by urban core residents rose a full 10 percent, from 29.7 percent to 32.7 percent (Figure 3).
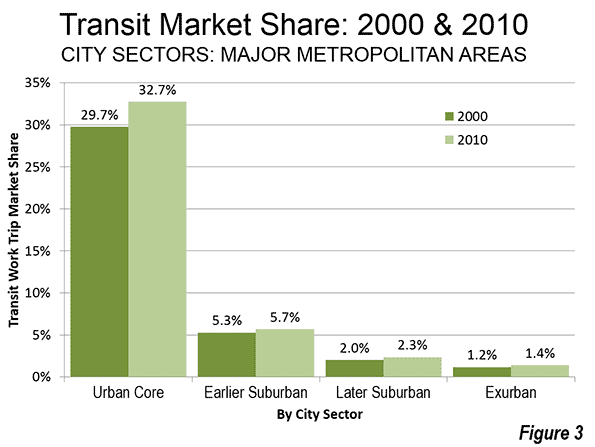
There were also transit commuting gains in the suburbs and exurbs. However, similar gains over the next quarter century would leave transit's share at below 5 percent in the suburbs and exurbs, because of its small base or ridership in these areas.
Walking and Cycling
The share of commuters walking and cycling (referred to as "active transportation" in the Queen's University research on Canada's metropolitan areas) rose 12 percent in the urban core (from 9.2 percent to 10.3 percent), even more than transit. This is considerably higher than in suburban and exurban areas, where walking and cycling remained at a 1.9 percent market share from 2000 to 2010.
Working at Home
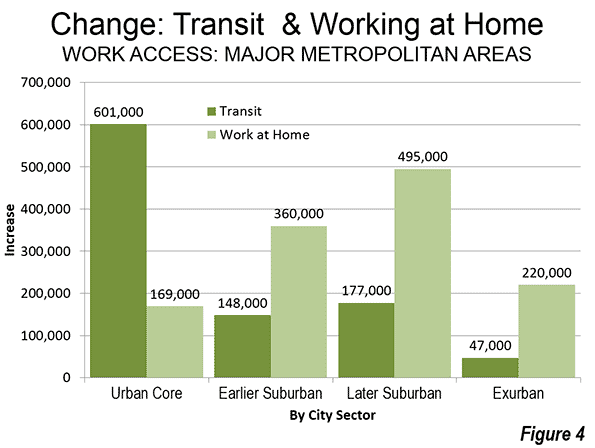
Working at home (including telecommuting) continues to grow faster than any work access mode, though like transit, from a small base. Working at home experienced strong increases in each of the four metropolitan sectors, rising a full percentage point or more in each. At the beginning of the decade, working at home accounted for less work commutes than walking and cycling, and by 2010 was nearly 30 percent larger.
The working at home largest gain was in the Earlier Suburban Areas, with a nearly 500,000 person increase. Unlike transit, working at home does not require concentrated destinations, effectively accessing employment throughout the metropolitan area, the nation and the world. As a result, working at home's growth is fairly constant across the urban core, suburbs and exurbs (Figure 4). Working at home has a number of advantages. For example, working at home (1) eliminates the work trip, freeing additional leisure or work time for the employee, (2) eliminates greenhouse gas emissions from the work trip, (3) expands the geographical area and the efficiency of the labor market (important because larger labor markets tend to have greater economic growth and job creation, and it does all this without (4) requiring government expenditure.
Driving Alone
Despite empty premises about transit's potential, driving remains the only mode of transport capable of comprehensively serving the modern metropolitan area. Driving alone has continued its domination, rising from 73.4 percent to 73.5 percent of major metropolitan area commuting and accounting for three quarters of new work trips. In the past decade, driving alone added 6.1 million commuters, nearly equal to the total of 6.3 million major metropolitan area transit commuters and more than the working at home figure of 3.5 million. To be sure, driving alone added commuters in the urban core, but lost share to transit, dropping from 45.2 percent to 43.4 percent. In suburban and exurban areas, driving alone continued to increase, from 78.2 percent to 78.5 percent of all commuting.).
Density of Cars
The urban cores have by far the highest car densities, despite their strong transit market shares. With a 4,200 household vehicles available per square mile (1,600 per square kilometer), the concentration of cars in urban cores was nearly three times that of the Earlier Suburban areas (1,550 per square mile or 600 per square kilometer) and five times that of the Later Suburban areas (950 per square kilometer). Exurban areas, with their largely rural densities had a car density of 100 per square mile (40 per square kilometer).
Work Trip Travel Times
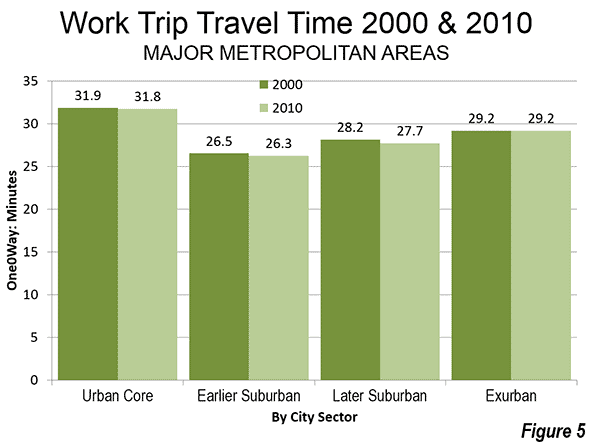
Despite largely anecdotal stories about the super-long commutes of those living in suburbs and exurbs, the longest work trip travel times were in the urban cores, at 31.8 minutes one-way. The shortest travel times were in the Earlier Suburbs (26.3 minutes) and slightly longer in the Later Suburbs (27.7 minutes). Exurban travel times were 29.2 minutes. Work trip travel times declined slightly between 2000 and 2010, except in exurban areas, where they stayed the same. The shorter travel times are to be expected with the continuing evolution from monocentric to polycentric and even "non-centric" employment patterns and a stagnant job market (Figure 5).
Contrasting Transportation in the City Sectors
The examination of metropolitan transportation data by city sector highlights the huge differences that exist between urban cores and the much more extensive suburbs and exurbs. Overall the transit market share in the urban core approaches nine times the share in the suburbs and exurbs. The walking and cycling commute share in the urban core is more than five times that of the suburbs and exurbs. Moreover, the trends of the past 10 years indicate virtually no retrenchment in automobile orientation, as major metropolitan areas rose from 84 percent suburban and exurban in 2000 to 86 percent in 2010. This is despite unprecedented increases is gasoline prices and the disruption of the housing market during worst economic downturn since the Great Depression.
----------------------------
Wendell Cox is principal of Demographia, an international public policy and demographics firm. He is co-author of the "Demographia International Housing Affordability Survey" and author of "Demographia World Urban Areas" and "War on the Dream: How Anti-Sprawl Policy Threatens the Quality of Life." He was appointed to three terms on the Los Angeles County Transportation Commission, where he served with the leading city and county leadership as the only non-elected member. He was appointed to the Amtrak Reform Council to fill the unexpired term of Governor Christine Todd Whitman and has served as a visiting professor at the Conservatoire National des Arts et Metiers, a national university in Paris.
Photograph: DART light rail train in downtown Dallas (by author)
----------------------------
City Sector Note: Previous articles in this series are listed below:
From Jurisdictional to Functional Analyses of Urban Cores & Suburbs
The Long Term: Metro American Goes from 82 percent to 86 percent Suburban Since 1990
Functional v. Jurisdictional Analysis of Metropolitan Areas
City Sector Model Small Area Criteria


does paleo burn actually work
This is not surprising, because the urban cores of these metropolitan areas developed during the heyday does paleo burn actually work
rob judge unlock her legs system reviews
developed during the heyday of transit dominance, and before broad automobile availability. Indeed, urban core transit commuting became even more concentrated over the past decade. rob judge unlock her legs system reviews
Much of the gain has been in
Much of the gain has been in the urban cores, which house only 14 percent of metropolitan area population. Virtually all of the urban core gain (99 percent) has been in the six metropolitan Farby palette opinie