KPMG Australia analysis shows the country is in the midst of a baby recession as births across the country fall by 4.6 per cent year on year. The number of births in 2023 was the lowest since 2006 as cost-of-living pressures impact the feasibility of younger Australians to have children.
During 2023, 289,100 babies were born in Australia, a significant reduction from the 2021 post-lockdown spike which saw 315,200 babies born.
KPMG Urban Economist Terry Rawnsley explains that weak growth in the economy often leads to reduced birth rates, but that current cost-of-living pressures are having a particularly strong impact.
“Birth rates provide insight into long-term population growth as well as the current confidence of Australian families.”
“We haven't seen such a sharp drop in births in Australia since the period of economic stagflation in the 1970s, which coincided with the initial widespread adoption of the contraceptive pill.”
Terry Rawnsley continues: “Following the uncertainty of pandemic lockdowns people who had held off having children decided to start families. The record-low unemployment rate and the stimulus money that flowed into the economy had provided encouragement for people to start having children again.”
“With the current rise in living expenses applying pressure on household finances, many Australians have decided to delay starting or expanding their families. This combination of the pandemic and rapid economic changes explains the spike and subsequent sharp decline in birth rates we have observed over the past four years.”
“This is against the backdrop of a long-term decline in the total fertility rate, which has declined from over 2 children per woman in 2008 to 1.6 in 2023,” said Mr Rawnsley.
Capital cities trending down
The drop in births is more pronounced in the capital cities with:
- Sydney births dropping to 60,860 down 8.6 per cent from 2019
- Melbourne with 56,270 births down 7.3 per cent
- Perth with 25,020 births down 6.0 per cent
- Brisbane with 30,250 births down 4.3 per cent
Canberra was the only capital city to see no drop in births since 2019, holding steady at 5,530 in both 2019 and 2023.
Terry Rawnsley explains, “CPI growth in Canberra has been slightly subdued compared to that in other major cities, and the economic outlook has remained strong. This means families have not been hurting as much as those in other capital cities, and in turn, we’ve seen a stabilisation of births in the ACT.”
Sea and tree change boom is over for the regions
Most regional areas have fared better than the cities with only modest declines in births compared to 2019:
- Regional NSW declining 0.3 per cent
- Regional Victoria declining 0.4 per cent
- Regional Queensland declining 2.9 per cent
The declines signal the end of the pandemic sea and tree change boom for the regions.
“Births across most regions have returned to pre-pandemic levels as the baby boom driven by younger Australians shifting to the regions ran out of steam,” said Terry Rawnsley.
Tasmania was the only region to see a noticeable increase in births compared to 2019 with 5,850 up 2.1 per cent.
Total births by region 2019-2023
| 2019 | 2020 | 2021 | 2022 | 2023* | 2019-2023 change |
|
| Greater Sydney | 66,570 | 64,090 | 69,270 | 64,670 | 60,860 | -8.6% |
| Rest of NSW | 31,450 | 30,970 | 33,670 | 33,830 | 31,340 | -0.3% |
| Greater Melbourne | 60,690 | 57,310 | 59,440 | 58,740 | 56,270 | -7.3% |
| Rest of VIC | 16,130 | 16,170 | 17,290 | 17,090 | 16,060 | -0.4% |
| Greater Brisbane | 31,610 | 30,570 | 33,130 | 31,810 | 30,250 | -4.3% |
| Rest of QLD | 29,970 | 28,950 | 32,160 | 30,840 | 29,100 | -2.9% |
| Greater Adelaide | 15,560 | 14,810 | 16,130 | 15,740 | 15,440 | -0.8% |
| Rest of SA | 3,890 | 3,730 | 4,000 | 3,910 | 3,790 | -2.6% |
| Greater Perth | 26,620 | 25,660 | 27,580 | 25,300 | 25,020 | -6.0% |
| Rest of WA | 6,610 | 6,510 | 6,880 | 6,250 | 6,070 | -8.2% |
| Tasmania | 5,730 | 5,790 | 6,150 | 5,560 | 5,850 | +2.1% |
| Northern Territory | 3,650 | 3,760 | 3,860 | 3,650 | 3,520 | -3.6% |
| Canberra | 5,510 | 5,380 | 5,650 | 5,510 | 5,530 | 0.4% |
*KPMG preliminary estimate
This piece first appeared at KPMG.
Research by Terry Rawnsley, Urban Economist with KPMG.
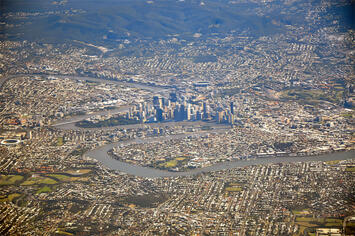
Photo: Brisbane CBD and metropolitan area by Jorge Láscar via Flickr under CC 2.0 License.


