What have the last two years of modest recovery meant to the growth and redistribution of population among the states? New data on the components of change for states are now available. In March county level data will permit a more detailed portrait.
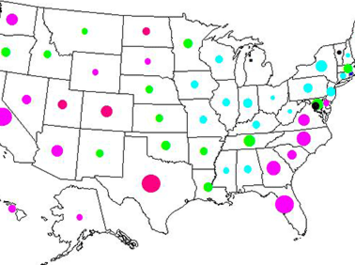
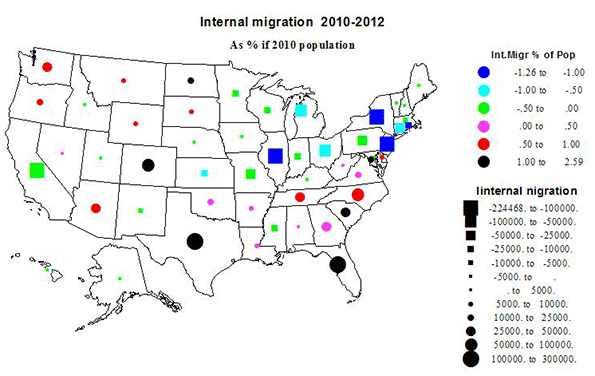
For states I present four maps, overall population change, change from natural increase, immigration (net international migration) and internal migration between states.
Population Change
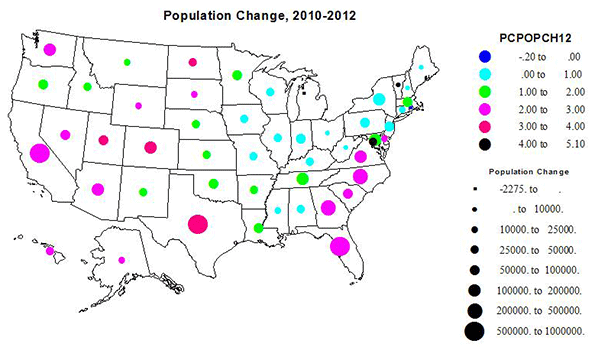
Not surprisingly, most of the states with larger absolute and percent gains continue trends from the last decade: the South Atlantic states from Florida to Delaware, in the South dominantly Texas (both amount and rate), along with Colorado and Washington State as centers of substantial Western growth. But North Dakota, due to rapid energy development, is the prime addition to the “winning” state for growth, with South Dakota following. The District of Columbia had the highest rate of growth,a beneficiary of expanding government growth, and perhaps more importantly, power.
Conversely, low rates of growth, even a loss for Rhode Island and possibly Michigan, characterize the northeast and the south central states.
Natural Increase
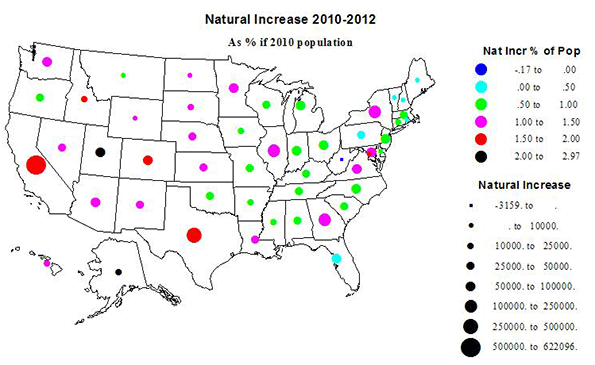
For most states, natural increase (the difference between births and deaths) is the largest component of growth. The rates and amounts are significant to overall growth across the west, California still leads in absolute growth, entirely due to natural increase. In contrast Utah and Idaho also stand out for high rates, in part from their Mormon population. Some slower growth northeastern states do have substantial natural increase, due to their size, including IL, MI, OH, and NY, while NC and SC and especially FL have lower rates of natural increase due to aging of their populations and migration of older people from the north.
Immigration
Total US population growth from 2010-2012 was 5.17 million, of which 3.32 million was from natural increase (8.9 million births and 5.6 million deaths), leaving a substantial part of growth from international migration of 1.85 million. Despite the flak about immigration, the pace has not slowed.
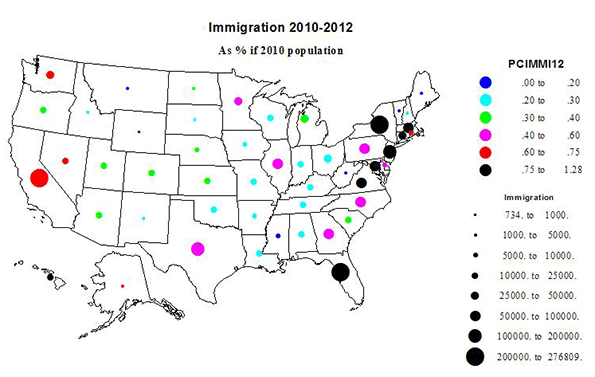
While immigration in the West (CA, WA, HI) of 277,000 remains significant, the dominant flow of immigrants went to the Atlantic seaboard states – how old-fashioned! – such as greater New York, Florida, and increasingly to GA and NC. New York gained 210,000 and Florida 212,000! Immigration was fairly modest to the interior of the country. This reflects largely the decreasing immigration from Mexico. Illinois (with a gain of 61,000 from immigration) and Texas are both are experiencing slowdowns. And note that AZ and NM immigration have become quite small.
The highest rate of immigration was to HI followed by NJ and FL.
Internal Migration
The volume of interstate migration was still lower than was typical in the 1960s through the 1990s, but still potent in explaining the growth differential among the states.
The pattern of absolute and relative gains and losses was essentially a continuation of trends over the last twenty years, with net in-migration to much, but not all of the South and to the West, except for California, which grows from natural increase and immigration but loses to the rest of the country.
Texas, with a net gain of 291,000, easily grew the most, followed by Florida (219,000), then North Carolina (72,000) and Colorado (62000). The highest rate was North Dakota, with net in-migration at 2.6% of the base population, followed by the District of Columbia (2.35%) and Colorado (1.24%). The North Dakota phenomenon is the most remarkable, since it marks an abrupt reversal from decades of loss, and of unknown duration. In the West, Colorado became the preferred destination, followed by Washington, with Arizona and Nevada less popular than a decade earlier. South Dakota also changed to a small gain due to its strong economy and low unemployment.
Out-migration characterized 28 states, encompassing the entire northeastern part of the country, from Minnesota to Maine, Kansas and Nebraska to Pennsylvania and New Jersey, and several states experienced high amounts and rates of loss, e.g. New York, -224,000; Illinois, -156,000; New Jersey, -103,000; and Michigan, -93,000; but the highest rates of loss were for Rhode Island, Illinois, New Jersey and New York. Outside the northeast, the biggest loss, as usual was for California: 104,000.
Differences in Components of Change From the 2000-2010 Decade
Population growth
Overall the rates of population growth, of natural increase, and of international immigration are remarkably unchanged. The perhaps surprising turnarounds towards much greater rates of growth occurred in DC, LA (recovery from Katrina), and the Dakotas. States whose growth slowed markedly were AZ, ID, NV, NM, and UT in the West (partly due to much lower migration from Mexico), and Georgia. Only RI shifted from growth to a loss.
AK, HI, LA and ND enjoyed increased immigration, while it fell for AZ, CO, NM and TX. Natural increase grew in ND and DC.
Internal migration
DC, LA and ND changed the most, changing from losses to gains, and CO and SD had increased rates. Twelve states had lower rates of in-migration: AL, AZ, AR, DE, GA, KY, NV, NC, OK, OR, SC, and even VA – presumably a recession effect. But it was worse for seven states which shifted from gains to losses: ID, ME, MO, NH, NM, PA and VT, and for 3 states with bigger losses: CT, IN and NJ. But then seven states reduced rates of loss: CA, HI, IA, MD, MA, NE, and NY. Obvious explanations for some of these changes do not spring quickly to mind.
What all this shows is that it is hard to make long term projections on the basis of seemingly robust trends over even fairly long periods. Preferences change, economic sectors rise and fall.
Political Implications
Analysis of the 2012 elections have shown that the Obama victory is a consequence of demographic change as the country shifts from a domination of white males to a rainbow coalition of yes, white liberals, mostly urban, but propelled largely by a strongly supportive minority population moving toward a majority. At first glance the maps seem to tell us that growing areas in the South and mountain states favor the Republicans while the declining Northeast was the stronghold of Democrats. Yet it is more complex, since states like Virginia, Florida, Colorado and even North Carolina – all with large and growing minority as well as white urban populations – vote increasingly Democratic.
Richard Morrill is Professor Emeritus of Geography and Environmental Studies, University of Washington. His research interests include: political geography (voting behavior, redistricting, local governance), population/demography/settlement/migration, urban geography and planning, urban transportation (i.e., old fashioned generalist).


