
California Senate President Pro-Tem Darrell Steinberg countered my Wall Street Journal commentary California Declares War on Suburbia in a letter to the editor (A Bold Plan for Sustainable California Communities) that could be interpreted as suggesting that all is well in the Golden State. The letter suggests that business are not being driven away to other states and that the state is "good at producing high-wage jobs," while pointing to the state's 10 percent growth over the last decade. Senate President Steinberg further notes that the urban planning law he authored (Senate Bill 375) is leading greater housing choices and greater access to transit.
This may be a description of the California past, but not present.
Exporting People
Yes, California continues to grow. California is growing only because there are more births than deaths and the state had a net large influx of international immigration over the past decade. At the same time, the state has been hemorrhaging residents (Figure 1).
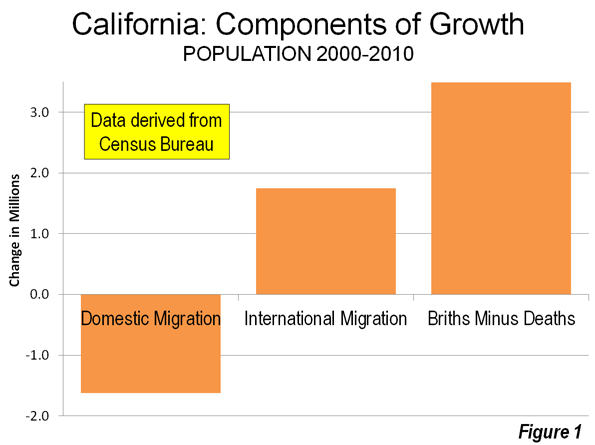
Californians are leaving. Between 2000 and 2009 (Note), a net 1.5 million Californians left for other states. Only New York lost more of its residents (1.6 million). California's loss was greater than the population of its second largest municipality, San Diego. More Californians moved away than lived in 12 states at the beginning of the decade. Among the net 6.3 million interstate domestic migrants in the nation, nearly one-quarter fled California for somewhere else.
The bulk of the exodus was from the premier coastal metropolitan areas. Since World War II, Los Angeles, San Francisco, San Diego and San Jose have been among the fastest growing metropolitan areas in the United States and the high-income world. Over the last decade, this growth has slowed substantially, as residents have moved to places that, all things being considered, have become their preferences.
More than a net 1.35 million residents left the Los Angeles metropolitan area, or approximately 11 percent of the 2000 population. The San Jose metropolitan area lost 240,000 residents, nearly 14 percent of its 2000 population. These two metropolitan areas ranked among the bottom two of the 51largest metropolitan areas (over 1,000,000 population) in the percentage of lost domestic migrants during the period. The San Francisco metropolitan area lost 340,000 residents, more than 8 percent of its 2000 population and ranked 47th worst in domestic migration (New York placed worse than San Francisco but better than Los Angeles). Each of these three metropolitan areas lost domestic migrants at a rate faster than that of Rust Belt basket cases Detroit, Cleveland and Buffalo.
San Diego lost the fewest of the large coastal metropolitan areas (125,000). Even this was double the rate of Rust Belt Pittsburgh.
Exporting Jobs
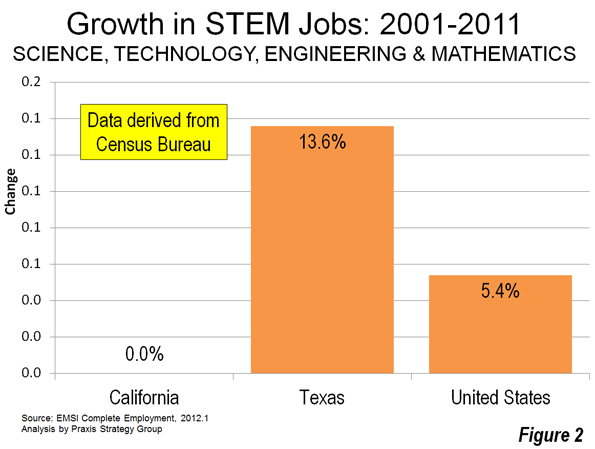
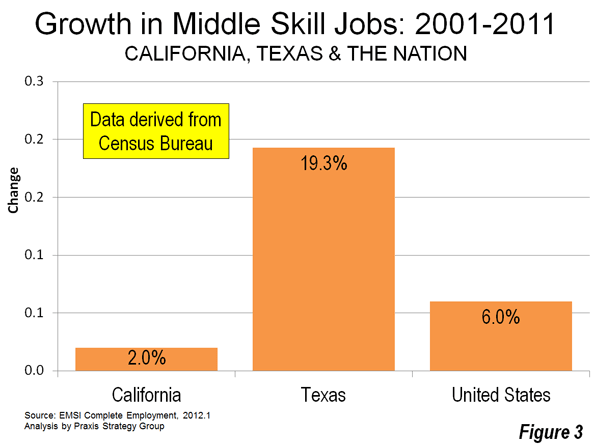
California is no longer an incubator of high-wage jobs. The state lost 370,000 jobs paying 25 percent or more of the average wage between 2000 and 2008. This compares to a 770,000 increase in the previous 8 years. California is trailing Texas badly and the nation overall in creating criticial STEM jobs and middle skills jobs (Figures 2 & 3) Only two states have higher unemployment rates than California (Nevada and Rhode Island) . California has the second highest underemployment rate (20.8 percent), which includes the number of unemployed, plus those who have given up looking for work ("discouraged" workers) and those who are working only part time because they cannot find full time work. Only Nevada, with its economy that is overly-dependent on California, has a higher underemployment rate.
Business relocation coach Joseph Vranich conducts an annual census of companies moving jobs out of California and found a quickening pace in 2012. Often these are the very kinds of companies capable of creating the high-wage jobs that used to be California's forte. Vranich says that the actual number may be five times as high, which is not surprising, not least because there is no reliable compilation of off-shoring of jobs to places like Bangalore, Manila or Cordoba (Argentina).
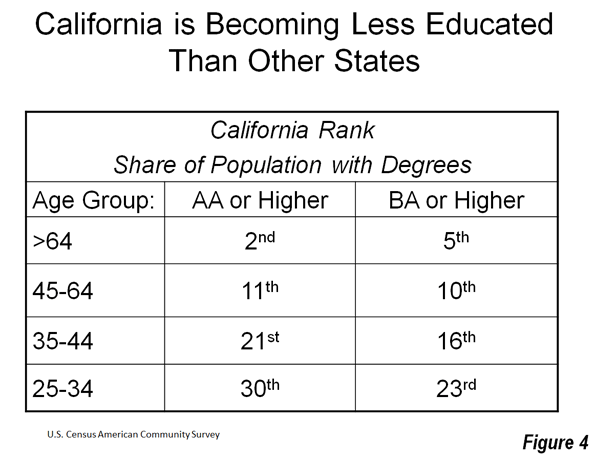
To make matters worse, California is becoming less educated. California's share of younger people with college degrees is now about in the middle of the states, while older, now retiring Californians are among the most educated in the nation (Figure 4).
Denying Housing Choice
It is fantasy to believe, as Steinberg claims, that there are enough single family (detached) houses in the state to meet the demand for years to come. More than 80 percent of the new households in the state chose detached housing over the last decade. People's actual choices define the market, not the theories or preferences of planners often contemptuous of the dominant suburban lifestyle.
In contrast, however, the regional plans adopted or under consideration in the Bay Area, Los Angeles and San Diego would require nearly all new housing be multi-family, at five to 10 times normal California densities (20 or more units to the acre are being called for). New detached housing on the urban fringe would be virtually outlawed by these plans. And, when Sacramento does not find the regional plans dense enough, state officials (such as the last two state Attorneys General) are quick to sue. If the "enough detached housing" fantasy held any water, state officials and planners would not be seeking its legal prohibition. To call outlawing the revealed choice of the 80 percent (detached housing) would justify the equivalent of a Nobel Prize in Doublespeak.
At the same time by limiting the amount of land on which the state preferred high density housing must be built, land and house prices can be expected to rise even further from their already elevated levels (already largely the result of California's pre-SB 375 regulatory restrictions).
Transit Rhetoric and Reality
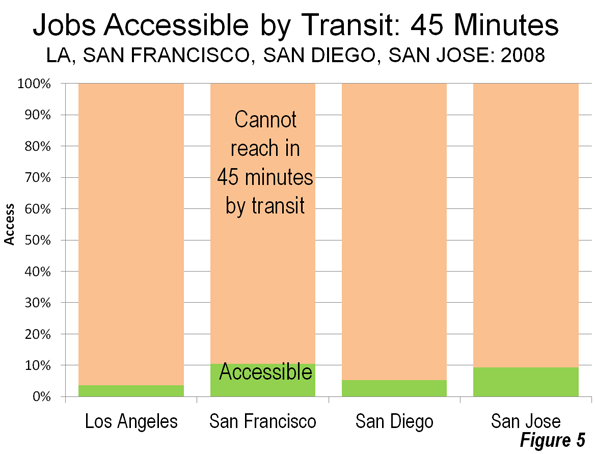
Transit is important in some markets. About one-half of commuters to downtown San Francisco use transit. The assumptions of SB 375 might make sense if all of California looked like downtown San Francisco. It doesn't, nor does even most of the San Francisco metropolitan area. Only about 15 percent of employment is downtown, while the 85 percent (and nearly all jobs in the rest of the state) simply cannot be reached by transit in a time that competes with the car. Even in the wealthy San Jose area (Silicon Valley), with its light rail lines and commuter rail line, having a transit stop nearby provides 45 minute transit access to less than 10 percent of jobs in the metropolitan area.
A recent Brookings Institution report showed that the average commuter in the four large coastal metropolitan areas can reach only 6.5 percent of the jobs in a 45 minute transit commute. This is despite the fact that more than 90 percent of residents can walk to transit stops. Even when transit is close, you can't get there from here in most cases in any practical sense (Figure 5).
SB 375 did little to change this. For example, San Diego plans to spend more than 50 percent of its transportation money on transit over the next 40 years. This is 25 times transit's share of travel (which is less than 2 percent). Yet, planners forecast that all of this spending will still leave 7 out of 8 work and higher education trips inaccessible by transit in 30 minutes in 2050. Already 60 to 80 percent of work trips in California are completed by car in 45 minutes and the average travel time is about 25 minutes.
For years, planners have embraced the ideal of balancing jobs and housing, so that people would live near where they work, while minimizing travel distances. This philosophy strongly drives the new SB 375 regional plans. What these plans miss is that people choose where to work from the great array of opportunities available throughout the metropolitan area. These varied employment opportunities that are the very reason that large metropolitan areas exist, according to former World Bank principal planner Alain Bertaud.
People change jobs far more frequently than before and multiple earners in households are likely to work far apart. Similar intentions led to the development up to four decades ago of centers like Tensta in Stockholm, which ended up as concentrated low income areas (Photo). It California, such a concentration would do little to improve transit ridership, even low-income citizens are four to 10 times as likely use cars to get to work than to use transit.
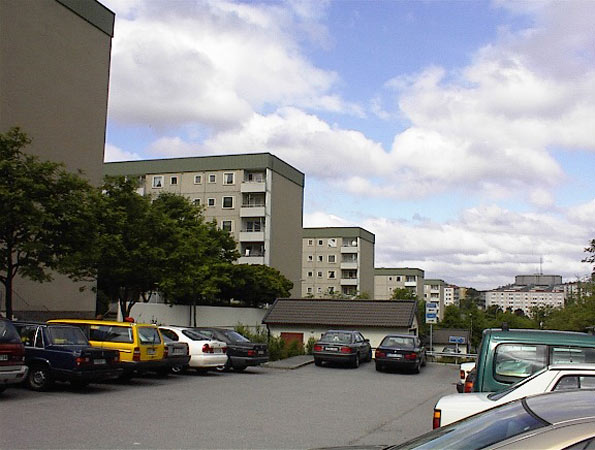
Tensta Transit Oriented Development: Stockholm
All of this means more traffic congestion and more intense local air pollution, because higher population densities are associated with greater traffic congestion. Residents of the new denser housing would face negative health effects because there is more intense air pollution, especially along congested traffic corridors.
Self-Inflicted Wounds
Worst of all, California's radical housing and transportation strategies are unnecessary. The unbalanced and one-dimensional pursuit of an idealized sustainability damages both quality of life and the economy. This is exacerbated by other issues, especially the state's dysfunctional economic and tax policies. It is no wonder California is exporting so many people and jobs. California's urban planning regime under SB 375 is poised to make it worse.
Wendell Cox is a Visiting Professor, Conservatoire National des Arts et Metiers, Paris and the author of “War on the Dream: How Anti-Sprawl Policy Threatens the Quality of Life”.
| Net Domestic Migration: 2000-2009 | |||
| Rank | Metropolitan Area | Net Domestic Migration | Compared to 2000 Population |
| 1 | Raleigh, NC | 194,361 | 24.2% |
| 2 | Las Vegas, NV | 311,463 | 22.4% |
| 3 | Charlotte, NC-SC | 248,379 | 18.5% |
| 4 | Austin, TX | 234,239 | 18.5% |
| 5 | Phoenix, AZ | 543,409 | 16.6% |
| 6 | Riverside-San Bernardino, CA | 469,093 | 14.3% |
| 7 | Orlando, FL | 225,259 | 13.6% |
| 8 | Jacksonville, FL | 126,766 | 11.3% |
| 9 | Tampa-St. Petersburg, FL | 260,333 | 10.8% |
| 10 | San Antonio, TX | 177,447 | 10.3% |
| 11 | Atlanta, GA | 428,620 | 10.0% |
| 12 | Nashville, TN | 123,199 | 9.4% |
| 13 | Sacramento, CA | 141,117 | 7.8% |
| 14 | Richmond, VA | 75,886 | 6.9% |
| 15 | Portland, OR-WA | 121,957 | 6.3% |
| 16 | Dallas-Fort Worth, TX | 317,062 | 6.1% |
| 17 | Houston, TX | 243,567 | 5.1% |
| 18 | Indianapolis. IN | 72,517 | 4.7% |
| 19 | Oklahoma City, OK | 41,082 | 3.7% |
| 20 | Denver, CO | 66,269 | 3.0% |
| 21 | Louisville, KY-IN | 34,381 | 3.0% |
| 22 | Birmingham, AL | 26,934 | 2.6% |
| 23 | Columbus, OH | 34,204 | 2.1% |
| 24 | Kansas City, MO-KS | 31,747 | 1.7% |
| 25 | Seattle, WA | 40,741 | 1.3% |
| 26 | Minneapolis-St. Paul, MN-WI | (19,731) | -0.7% |
| 27 | Memphis, TN-MS-AR | (8,583) | -0.7% |
| 28 | Hartford, CT | (9,349) | -0.8% |
| 29 | Cincinnati, OH-KY-IN | (17,648) | -0.9% |
| 30 | Virginia Beach-Norfolk, VA-NC | (20,005) | -1.3% |
| 31 | Baltimore, MD | (36,407) | -1.4% |
| 32 | St. Louis, MO-IL | (43,750) | -1.6% |
| 33 | Philadelphia, PA-NJ-DE-MD | (115,890) | -2.0% |
| 34 | Pittsburgh, PA | (52,028) | -2.1% |
| 35 | Washington, DC-VA-MD-WV | (107,305) | -2.2% |
| 36 | Providence, RI-MA | (49,168) | -3.1% |
| 37 | Salt Lake City, UT | (34,428) | -3.5% |
| 38 | Rochester, NY | (40,219) | -3.9% |
| 39 | San Diego, CA | (126,860) | -4.5% |
| 40 | Buffalo, NY | (55,162) | -4.7% |
| 41 | Milwaukee,WI | (74,453) | -5.0% |
| 42 | Boston, MA-NH | (235,915) | -5.4% |
| 43 | Miami, FL | (287,135) | -5.7% |
| 44 | Chicago, IL-IN-WI | (561,670) | -6.2% |
| 45 | Cleveland, OH | (136,943) | -6.4% |
| 46 | Detroit, MI | (366,790) | -8.2% |
| 47 | San Francisco-Oakland, CA | (347,375) | -8.4% |
| 48 | New York, NY-NJ-PA | (1,962,055) | -10.7% |
| 49 | Los Angeles, CA | (1,365,120) | -11.0% |
| 50 | San Jose, CA | (240,012) | -13.8% |
| 51 | New Orleans, LA | (301,731) | -22.9% |
| Data from US Census Bureau | |||
-----
Note: 2000 to 2010 data not available
Lead photo: Largely illegal to build housing under California Senate Bill 375 planning


