We recently noted that Ryan Avent was one third right in his recent Sunday New York Times article on urban density. Avent has posted a response suggesting that it is inappropriate to use average urban densities in urban productivity analyses, as we had done, but that "weighted average densities" should be used instead. Weighted average density was not mentioned in his New York Times article.
In the interim, we were able to find the studies on urban density and productivity that seem to match those Avent refers to in his New York Times article. There are two studies concluding that doubling employment (not population) density increases productivity by six percent (Ciccone & Hall, 1996 and Harris & Ioannides, 2000), as Avent noted. Another study (Davis, Fisher & Whited, 2007) indicates that doubling employment densities could increase productivity by as much as 28 percent, also as Avent noted.
Urban and Rural Density Combined Are Not Urban Density: In contrast to Avent's preference for weighted average density, each of the studies uses average density, like with our analysis. More importantly the econometric formulas in the studies do not include an urban density variable. The density variables in all three studies include rural areas.
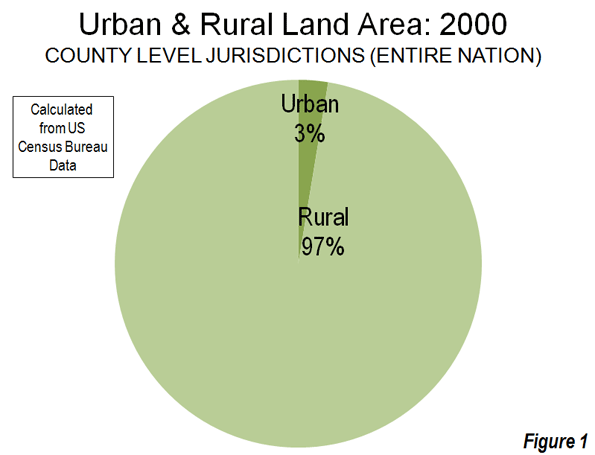
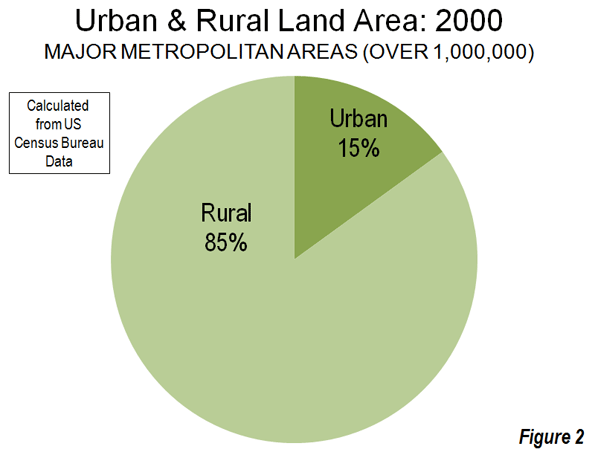
The studies use county, metropolitan area and sub-metropolitan area densities, each of which contain far more rural land than urban land. By definition, urban areas exclude rural areas and, as a result, the moment rural areas become a part of the calculation, the result cannot be urban densities. In 2000, Census Bureau data showed counties (county equivalent level jurisdictions), which comprise the entire nation, to be less than three percent urban and more than 97 percent rural (Figure 1). Metropolitan areas also have a similar predominance of rural land (Figure 1). Among major metropolitan areas (those with more than 1,000,000 population) in 2000, approximately 85 percent of the land was rural and 15 percent of the land was urban (Figure 2).


Ciccone & Hall use employment density at the county level and thus mix urban and rural densities. Harris & Ioannides use employment densities at the metropolitan statistical area or the primary metropolitan statistical area level (a sub-metropolitan designation since replaced by the more appropriately titled "metropolitan division"). Davis, Fisher & Whited use employment densities at the metropolitan statistical area level. The two studies using metropolitan areas or parts of metropolitan areas also mix urban and rural densities.
Urban Area Densities: Urban density is calculated at the urban area level, which is the area of continuous urban development. This is also called the urban footprint, which is generally indicated by the lights of the city one would see from an airplane on a clear night. Urban areas are delineated using the smallest census geographical units ("census blocks," which are smaller than census tracts) each ten years. The 2010 data will be released next year. Among urban areas, the highest density core urban area in a major metropolitan area (Los Angeles) is approximately four times the lowest (Birmingham).
Nonsensical Metropolitan Area Densities: Theoretically, metropolitan areas are labor market areas, which include a core urban area (and sometimes more than one urban area) and nearby rural areas from which people commute to work in the urban area (can be called the "commuter shed"). However, in the United States, metropolitan areas are too coarsely defined for density comparisons with one another. US metropolitan areas are composed of complete counties or, in the six New England states, complete towns. This jurisdictionally based criteria can produce metropolitan areas that are much larger than genuine labor markets in a number of cases and some that are smaller. American metropolitan areas are not spatially consistent by any functional labor market definition. Metropolitan densities are thus nonsensical, no matter what density is being measured (such as population or employment density). Among major metropolitan areas, the highest density metropolitan area (New York) is 24 times that of the lowest density (Salt Lake City), six times the maximum difference in urban area density.
Metropolitan Ireland and Happenstance: In the similarly sized San Francisco (as used by Davis, Fisher and Whited) and Riverside-San Bernardino metropolitan areas, San Francisco has 1,700 square miles of rural land, while Riverside-San Bernardino has 26,000, approximately 15 times as much. At more than 27,000 square miles, Riverside-San Bernardino covers more land area than the Republic of Ireland. The difference in population densities between metropolitan areas is determined in considerable measure by the size (land area) of the included counties, not by the number of people in cities.
If the state of California were to carve out a new county composed of western Riverside and San Bernardino counties (as Colorado created Bloomfield County in the early 2000s), the land area of the metropolitan area could be reduced 95 percent, because the remainder would not meet the criteria for inclusion in Riverside-San Bernardino. The importance of the density variable for Riverside-San Bernardino in econometric formulas would be increased many times. With only 3,100 county level jurisdictions of varying sizes, this kind of incomparability cannot help but occur. The boundaries of metropolitan areas are defined by political happenstance.
On the other hand, the nation's urban areas are built up from 7,000,000 census blocks. This permits a fine grained definition that makes urban areas appropriate for density comparisons. The definition of urban areas is beyond political fiat.
Metropolitan areas in the United States could be readily defined at the census block level, just like urban areas. Regrettably, the Office of Management and Budget missed another opportunity in the 2010 census to make the necessary criteria change. U.S. metropolitan area data is of great value for most analysis, but misleading for spatial or density analysis.
Low-Density Productivity: Subregionalizing the density and productivity analysis would pose problems. Avent uses household incomes as his standard (and we agree that cost of living differentials are important). The San Jose metropolitan area has the highest household incomes of any major metropolitan area and would therefore be among the most productive. Yet, San Jose's automobile-oriented Silicon Valley, to which much of the productivity is attributable, has a far lower employment density than the transit and pedestrian oriented cores of Manhattan and San Francisco (and yes, even not-so-transit oriented downtown Phoenix). In low-density Seattle, Microsoft's automobile oriented Redmond campus probably ranks among the most productive real estate in the country, yet its employment density (like that of Silicon Valley) pales by comparison to the higher density cores of Seattle, Phoenix, Nashville, Oklahoma City and virtually every other downtown core of a major metropolitan area.
At the End, Agreement: Avent concludes, "I just want to make sure we stop costing ourselves easy opportunities for growth." I could not agree more. It is time to abandon regulations that artificially raise housing prices, deprive households of a better standard of living, and drive them to places they would rather not live. For centuries, people have flocked to urban areas for better economic opportunities. Urban areas should be places where people can realize their aspirations, not places that repel them because it doesn't suit the interests of those already there.


Urban areas should be places
Urban areas should be places where people can realize their aspirations, not places that repel them because it doesn't suit the interests of those already there.seo
This website has very good
This website has very good content. so I am sure this website will form the well-known in the future. - grosir baju korea
Pretty interesting, just
Pretty interesting, just browsed through the posts here and I must say they are great.
Thanks by cara memperbesar alat vital
continue reading this
Please let me know if you're looking for a article author for your weblog. You have some really great posts and I feel I would be a good asset. If you ever want to take some of the load off, I'd love to write some material for your blog in exchange for a link back to mine. Please shoot me an email if interested. Thank you! - selimut
urban area densities
Why do you think it appropriate to average population density over an entire urban area rather than look at the distribution of population within the area? If you look at the New York area, something like half (or more) of the population lives at much higher densities than anywhere else in the country, perhaps barring one or two exceptions, yet your statistics look at an average that includes a land area stretching from Montauk to west of the Delaware River. I don't understand how that tells us anything. It reminds me of a saying I once heard: If you have your head in the oven and your feet in the freezer, on average you're feeling fine. Averages can be useful, but only if you have the right denominator sitting under the numerator.
Here are the US Census Bureau Criteria
Peter:
Thank you for your comment.
The NY urban area (area of continuous development) extends from eastern Long Island to somewhere west of (I-285), a considerably shorter distance than Montauk Point to the Delaware. That is the metropolitan area (labor market area) and actually extends across the Delaware to the western border of Pike county, and down to the southern border of Ocean County in NJ.
Further, Avent's economic citations for proving his density case were, as noted above, based upon densities measured at a much larger than urban area basis.
If you are interested in the logic behind urban densities and urban areas, I recommend looking at the urban area criteria of the Census Bureau, which are very similar to those of Stats Canada, National Statistics (UK), INSEE (France) and some other nations as well. http://www.census.gov/geo/www/ua/frnotice.html.
The bottom line is that there are two ways to measure the urban form... the physical (continuous urbanization) and the functional (labor market area or metropolitan area)... these classifications borrowed from the UK urbanist Sir Peter Hall (http://www.newgeography.com/content/002324-the-costs-smart-growth-revisi...). That may not satisfy everyone, but at any scale less broad measures only part of the urban form.
Best regards,
Wendell Cox
Demographia
www.demographia.com