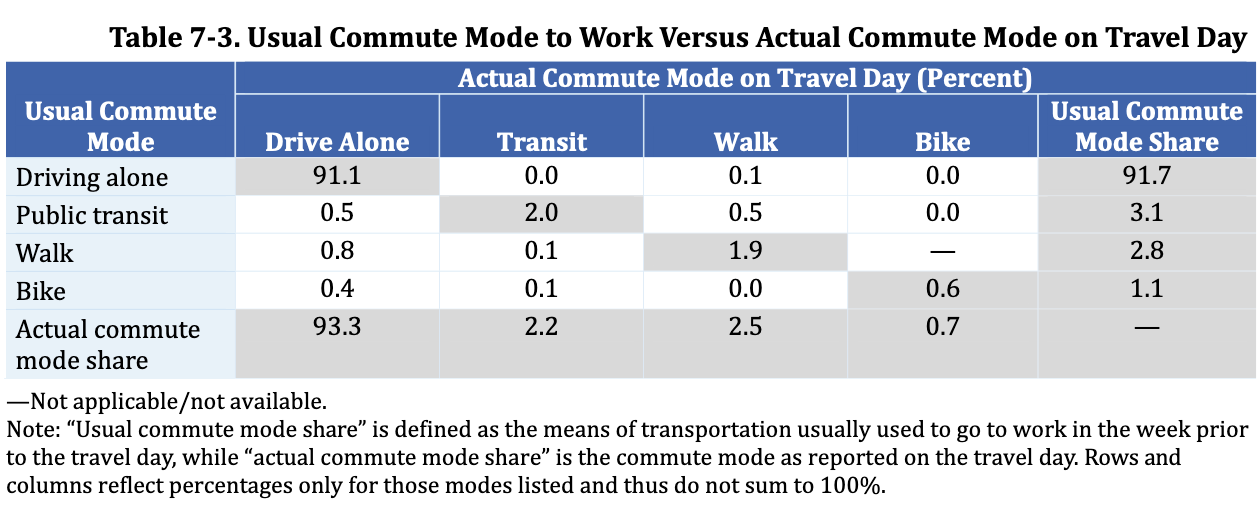
Data in the 2022 National Household Travel Survey (NTHS) provides insight into the daily frequency of daily commuting by the mode characterized as “usual” in survey (See: Summary of Travel Trends: 2022 National Household Travel Survey, Table 7-3, reproduced below as Figure 1). The annual American Community Survey (ACS), administered by the Census Bureau, asks respondents for their “usual” mode of travel over the past week. The Federal Highway Administration conducts the periodic National Household Travel Survey (NHTS), in which respondents indicate their travel mode on a particular day. By comparing the data from the two surveys, it is possible to estimate the percentage of commuter trips on a daily basis made relative to the indicated usual mode

Modal Reliability: This is related to what has been called public transport loyalty, which was the subject of recent Luxembourg labor market research. I choose the term “modal reliability,” which avoids the ideological misinterpretation that can be inferred by “loyalty.” Given that the consumer is considered by many to be “king” in market economies, modes of transport can be evaluated based on how reliable they are in meeting their needs and preferences. There are days that usual transit commuters drive alone, days that car drivers use transit, days, days with inclement weather that lead bicycle riders and those who walk to drive alone, The results are summarized below.
Modal Reliability: The Data: Thus, modal reliability is the measure of how a commuter’s usual mode of travel is represented in actual daily commuting. Thus, if the commuter’s usual mode is used 75% of the time, then the modal reliability is 75% If the commuter uses the usual mode 100% of the time, then modal reliability is 100%.
The NHTS provides the necessary information for four commuting modes --- driving alone, transit, walking and bicycle. The largest modes not included is ridersharing (such as car pooling) and working from home. The data is indicated in Figure 1, which shows that auto drivers used that mode of transport on the travel day 91.1%, while they used another mode of transport 0.1% of the time (walking). This would calculate to a reliability index of 99.0% . Among the four commute modes, driving alone has by far the highest reliability index.
Walking has the second highest modal reliability index, at 67.9%. Walking’s usual market share is 2.8%, but the travel day files indicate that 0.8% drive alone, while 0.1% of travel days are on transit.
Transit ranks third, with a modal reliability index of 67.9%. When “usual transit” riders are taking different modes, 16.1% are driving alone and 16.1% are walking.
Bicycles have the lowest modal reliability index, at 54.5%. When “usual” bicycle commuters are traveling by different modes, they are driving alone 36.4% of the time and 9.1% walking.
The above data indicates that driving alone is by far the most reliable form of commute travel. This should not be surprising, since cars are overwhelmingly the fastest mode of travel, and provide access to far more jobs. The latest University of Minnesota job access data for 50 metropolitan areas of more than 1,000,000 residents indicates that the average commuter can reach more than 60 times as many jobs within 30 minutes from home by car as by transit. Their reliability relative to the needs of commuters are why the average work trip travel time in the United States is 26.8 minutes, according to ACS data.
Transit Modal Reliability and Urban Rail Projections: Moreover, this data may explain at least somewhat why new transit rail projects so frequently fail to achieve their ridership projections. The transit modal reliability index suggests that about a third of usual transit riders use other modes about a third of the time.
Working From Home: The data does not include working from home, which in the United States exceeded transit in the 2010s. By the last pre-pandemic year, working from home accounted for 5.7% of usual work access, a bit higher than transit (5.0%). In 2023, the most recent year for which there is data, working from home accounted for 13.7% of usual work access, while transit had fallen to 3.5%.
Interestingly, one of transit’s commuting purposes was to substitute transit trips for driving alone. Over the decades virtually no progress was achieved with respect to this objective. In contrast, working from home quickly substituted for millions of work trips by cars.
Wendell Cox is principal of Demographia, an international public policy firm located in the St. Louis metropolitan area. He is a Senior Fellow with Unleash Prosperity in Washington and the Frontier Centre for Public Policy in Winnipeg and a member of the Advisory Board of the Center for Demographics and Policy at Chapman University in Orange, California. He has served as a visiting professor at the Conservatoire National des Arts et Metiers in Paris. His principal interests are economics, poverty alleviation, demographics, urban policy and transport. He is author of the annual Demographia International Housing Affordability Survey and author of Demographia World Urban Areas.
Mayor Tom Bradley appointed him to three terms on the Los Angeles County Transportation Commission (1977-1985), which was a predecessor agency to the Los Angeles County Metropolitan Transportation Authority (Metro). Speaker of the House Newt Gingrich appointed him to the Amtrak Reform Council, to complete the unexpired term of New Jersey Governor Christine Todd Whitman (1999-2002). He is author of War on the Dream: How Anti-Sprawl Policy Threatens the Quality of Life and Toward More Prosperous Cities: A Framing Essay on Urban Areas, Transport, Planning and the Dimensions of Sustainability.
Photo: Doug Bull, via Flickr, under CC 2.0 License.


