Further evidence of the continued dispersion of the US population is revealed by an examination of net domestic migration data and types of residences according to the American Community Survey, compared to the annual Census Bureau population estimates from 2020 through 2023.
Despite efforts of urban planners to outlaw single family zoning (detached houses) in some areas and pack families into cramped apartments, demographic date suggests people who move head to counties with more detached housing, not less.
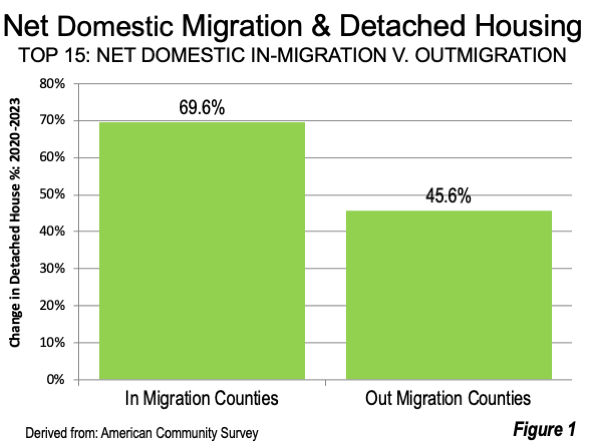
The counties gaining net domestic in-migration had a population weighted average detached housing rate of 69.2%. The counties that had net domestic out-migration had an average detached housing rate of 45.6%. The counties to which people moved had an average detached housing rate 52.6% higher than the counties from which people moved (Figure 1). This is yet another general indication of the increasing suburbanization and exurbanization of the nation. Suburban, exurban and rural areas tend to have higher percentages of detached housing, while urban core locations tend to have large multifamily, especially apartment shares.
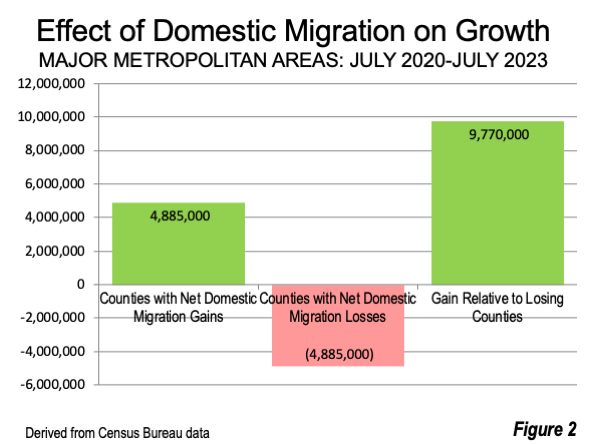
The Census Bureau net domestic migration data, indicates that 4.9 million people moved across county borders over the past three years. This means that as a result, the population of the counties with net domestic migration gains increased 9.8 million relative to the counties that lost net domestic migrants. (Figure 2)
Background
In the United States, net domestic migration is reported at the county level each year. A single net figure (“ins” minus “outs”) is provided for each of the more than 3,100 counties. This article compares the single-family (detached) occupied housing share in the counties with positive net domestic migration to the counties that lost net domestic migrants.
Detached housing accounts for 61.4% of residences (per the American Community Survey 2018-2023), and are most common in suburban, exurban and rural areas where population densities are below those of high-density urban cores.
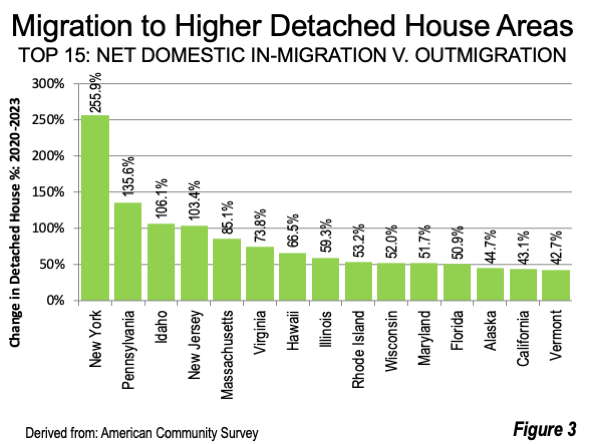
There were 15 states in which the in-migration county detached housing share exceeds that of outmigration counties by the largest margin (Figure 3). This is notable even in highly urbanized, blue states.,Moving New Yorkers are attracted to counties that have an average 256% higher share of detached housing. Movers from Pennsylvania, Idaho and New Jersey were destined to states with a100% or more detached housing share, Movers from Massachusetts, Virginia, Hawaii, Illinois, Rhode Island, Wisconsin, Maryland and Florida have been destined to areas with 50% to 100% greater detached housing share as. Alaska, California and Vermont rounded out the top 15, each above a 40% gain in detached housing share.
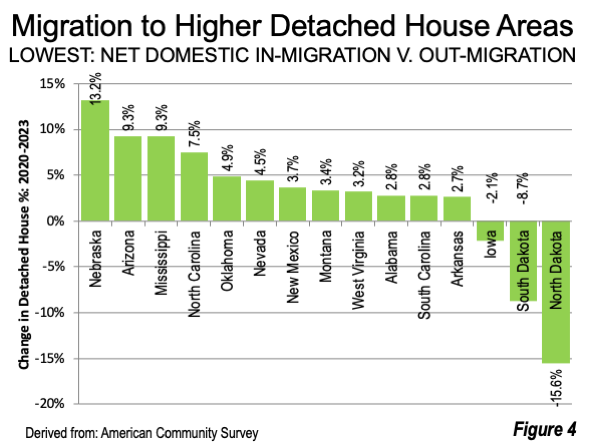
There were three states in which the opposite trend was shown, where movers new counties had a lower share of detached housing than where they moved from (Figure 4). These included North Dakota, South Dakota and Iowa. Even so, South Dakota and Iowa had a detached share of housing higher than the national average (61.4%), but below the former residence counties. North Dakota, however, had a lower detached housing share than the national rate. The overall trend remains: people are more likely to move to areas where single family homes predominate.
The table below provides data for the major metropolitan areas.
Similar Research
Other recently released research indicates that internal migration favors counties with lower urban population densities.
Americans Accelerate Move Away From Density showed that among all of the nation’s more than 3,100 counties and county equivalents, those that received net domestic migration between 2020 and 2023, urban densities were 82% lower (1,776 per square mile) than the counties from which there was a net domestic migration loss (9,920 per square mile).
More on the Flight from Density: Within Major Metropolitan Areas found a similar trend between 2020 and 2023 within major metropolitan areas. Counties within major metropolitan areas that gaining net domestic migrants had an average urban density 81% below (2,147 per square mile) that of major metro counties with net domestic migration losses (11,486 per square mile).
What This Means
At the fundamental level, this simply indicates that the trend toward suburbanization has only deepened. The United States has been suburbanizing for a century or more, with significant acceleration occurring following World War II. As the data above indicates, further acceleration has occurred over the last three years.
Wendell Cox is principal of Demographia, an international public policy firm located in the St. Louis metropolitan area. He is a Senior Fellow with the Frontier Centre for Public Policy in Winnipeg and a member of the Advisory Board of the Center for Demographics and Policy at Chapman University in Orange, California. He has served as a visiting professor at the Conservatoire National des Arts et Metiers in Paris. His principal interests are economics, poverty alleviation, demographics, urban policy and transport. He is co-author of the annual Demographia International Housing Affordability Survey and author of Demographia World Urban Areas.
Mayor Tom Bradley appointed him to three terms on the Los Angeles County Transportation Commission (1977-1985) and Speaker of the House Newt Gingrich appointed him to the Amtrak Reform Council, to complete the unexpired term of New Jersey Governor Christine Todd Whitman (1999-2002). He is author of War on the Dream: How Anti-Sprawl Policy Threatens the Quality of Life and Toward More Prosperous Cities: A Framing Essay on Urban Areas, Transport, Planning and the Dimensions of Sustainability.
Photo: The Villages, Florida in the fastest growing CBSA (metropolitan and micropolitan areas) in the nation out of more than 900, between 2020 and 2023 (over 16%). Source: Wikimedia under CC 4.0 License.
Table 1 (Back to reference)
| Net Domestic Migration: Gaining & Losing Counties 2023 |
||||
| State/DC | In | Out | Ins Divided by Outs |
Rank |
| Alabama | 69.7% | 67.8% | 2.8% | 42 |
| Alaska | 82.7% | 57.2% | 44.7% | 13 |
| Arizona | 66.7% | 61.0% | 9.3% | 34 |
| Arkansas | 71.8% | 69.9% | 2.7% | 44 |
| California | 73.0% | 51.0% | 43.1% | 14 |
| Colorado | 72.9% | 53.1% | 37.4% | 17 |
| Connecticut | 65.2% | 56.2% | 16.0% | 30 |
| Delaware | 64.4% | |||
| District of Columbia | 11.5% | |||
| Florida | 62.7% | 41.5% | 50.9% | 12 |
| Georgia | 76.8% | 58.8% | 30.6% | 18 |
| Hawaii | 77.3% | 46.5% | 66.5% | 7 |
| Idaho | 75.7% | 36.7% | 106.1% | 3 |
| Illinois | 76.4% | 47.9% | 59.3% | 8 |
| Indiana | 77.9% | 62.9% | 23.8% | 22 |
| Iowa | 70.9% | 72.5% | -2.1% | 45 |
| Kansas | 79.0% | 66.1% | 19.6% | 25 |
| Kentucky | 71.8% | 62.9% | 14.1% | 32 |
| Louisiana | 72.3% | 63.0% | 14.8% | 31 |
| Maine | 70.7% | |||
| Maryland | 66.1% | 43.6% | 51.7% | 11 |
| Massachusetts | 65.9% | 35.6% | 85.1% | 5 |
| Michigan | 79.4% | 67.6% | 17.5% | 28 |
| Minnesota | 76.8% | 55.4% | 38.6% | 16 |
| Mississippi | 73.6% | 67.4% | 9.3% | 35 |
| Missouri | 74.0% | 60.5% | 22.3% | 23 |
| Montana | 71.7% | 69.4% | 3.4% | 40 |
| Nebraska | 79.0% | 69.8% | 13.2% | 33 |
| Nevada | 60.6% | 58.0% | 4.5% | 38 |
| New Hampshire | 67.0% | |||
| New Jersey | 71.5% | 35.1% | 103.4% | 4 |
| New Mexico | 69.5% | 67.0% | 3.7% | 39 |
| New York | 64.4% | 18.1% | 255.9% | 1 |
| North Carolina | 69.4% | 64.6% | 7.5% | 36 |
| North Dakota | 46.0% | 54.5% | -15.6% | 47 |
| Ohio | 76.0% | 60.1% | 26.6% | 20 |
| Oklahoma | 76.7% | 73.2% | 4.9% | 37 |
| Oregon | 70.0% | 55.8% | 25.6% | 21 |
| Pennsylvania | 65.4% | 27.8% | 135.6% | 2 |
| Rhode Island | 71.4% | 46.6% | 53.2% | 9 |
| South Carolina | 64.2% | 62.4% | 2.8% | 43 |
| South Dakota | 64.5% | 70.7% | -8.7% | 46 |
| Tennessee | 72.0% | 60.3% | 19.4% | 26 |
| Texas | 71.3% | 59.1% | 20.6% | 24 |
| Utah | 71.9% | 61.4% | 17.1% | 29 |
| Vermont | 73.1% | 51.2% | 42.7% | 15 |
| Virginia | 78.0% | 44.9% | 73.8% | 6 |
| Washington | 69.7% | 54.8% | 27.0% | 19 |
| West Virginia | 72.0% | 69.8% | 3.2% | 41 |
| Wisconsin | 75.7% | 49.8% | 52.0% | 10 |
| Wyoming | 72.5% | 61.1% | 18.8% | 27 |
| All Counties | 69.6% | 45.6% | 52.6% | |
| Derived from ACS data. | ||||