While the debate continues unabated on the impact of the physical and land use characteristics of a city on crime a critical aspect is left out – resident transience. Jacobs took notice and feared its negative influence: was she right?
In her book (1961), Jacobs issued a thoughtful warning about the influence of tenancy on crime:
“I [….] anticipate with gloom and foreboding the recent news that exactly this transformation [turning a private property into multiple tenancy] is scheduled for the rest of the block frontage […]. A city neighborhood can absorb and protect a substantial number of these birds of passage, as our neighborhood does. But if and when the neighborhood finally becomes them, they will gradually find the streets less secure, […..].” And so, inevitably, will all others. Was she right?
This quote spells an unsubstantiated observation, a warning and an implied but unhelpful remedy; no statistical assessment of safety pre-and-post conversion and not even a speculative tenant (“them”) ratio are cited. This amounts to an ominous and instructive message for neighbourhoods but without specifics. So perhaps it’s time to test Jacobs’ thesis against the facts. We looked at various factors --- ownership, length of residency --- against the incidence of crime. We also tried to explore the notion of a threshold, a tipping point of reasonable safety.
Ownership, Renting and crime

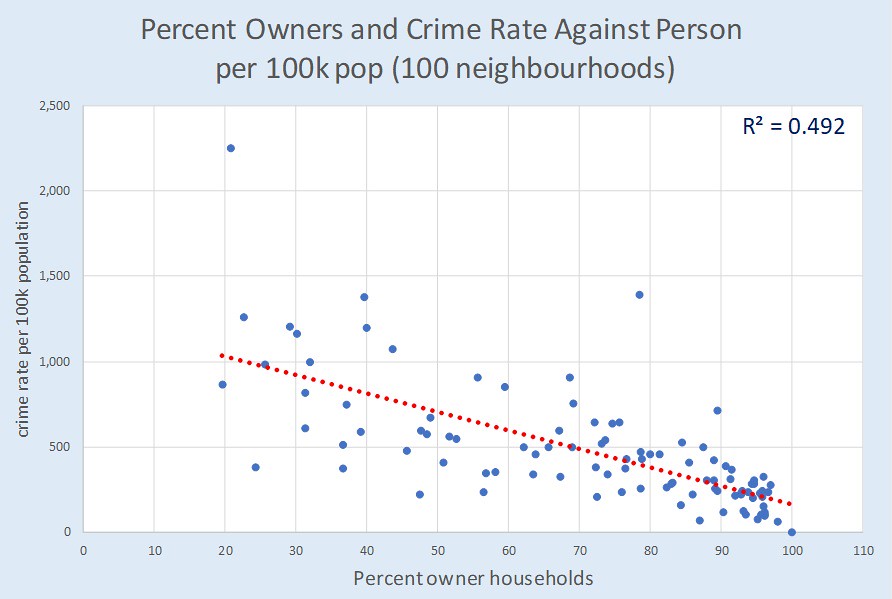
Figure 1. Relation of ownership rate and crime rate for 100 city neighbourhoods (Ottawa, ON)
Data: Ottawa Neighbourhood study
This strong correlation (R2=0.492, Fig 1) can be partly explained by the respective income levels of tenants and owners. Poverty has been indisputably correlated with crime. The average income of Ottawa renter households for 11 years (2006 – 2016) was 49% of those of owner households and a much higher percentage of renters households (32.3%) were in core need, those who pay more than 30 percent of their income on rent, than owner households (6.4%). Ownership, through demonstrable wealth, stands proxy also for education, a known factor in crime levels.
In this city, owners constitute 67.3 % of households and most cluster in identifiable districts. This concentration allows the data to highlight the differences in crime rates between homeowner districts to those with a varied mix of owners and tenants. If poverty is associated with crime and if tenants belong mostly to lower income quintiles, it stands to reason that the odds of crime increase with the tenant share. Figure 1 confirms that probability. Speculating on why or how relative wealth and education correlates with crime falls outside the focus of this piece. It suffices that it can now be shown with certainty that Jacob’s foreboding is borne out at least for this city: more tenants equals less safety. But what about the implied tenants’ relative transience?
Owners, renters and length of residency
Jacobs alluded to the high turnover and short stay of tenants in rental buildings on her street (“we don’t even recognise their faces”) as one contributing factor to decreased safety. What do we know about the length of residency among owners and tenants?

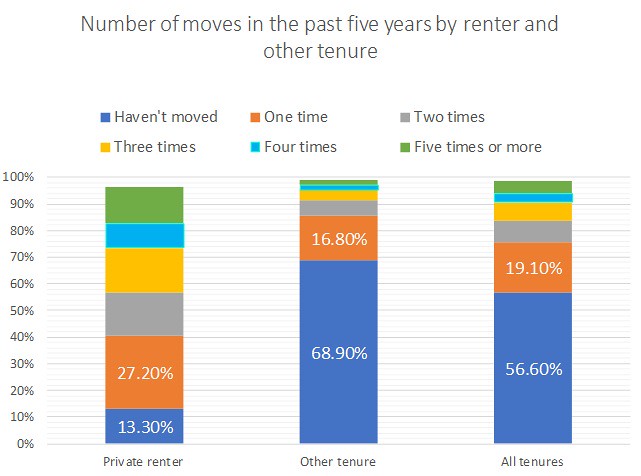
Figure 2. Length of Residency by tenure group
To paint a picture, we rely on US, British and Australian reported comprehensive statistics. Figure 2 shows that only 13.3% of private renters stayed in place in the last 5 years as opposed to five times that (68.9%) of other tenure types. Similarly, at the other end of move frequency, 7% of tenants moved five times in the same period as compared to about 1% percent of other tenures. Tenants’ relative mobility appears extraordinary. US statistics present a similar picture: Owners have been in their current location for 12 years versus tenants for only 2 years, only one sixth as long. An English housing survey shows very similar duration patterns: Owners have occupied their dwellings for an average of 16 years and tenants for just over 2 years (1/8). Statistics for Ottawa do not differentiate between tenants and owners’ residency length but it is reasonable to assume that they would closely follow the consistent pattern reported by these three OECD countries.

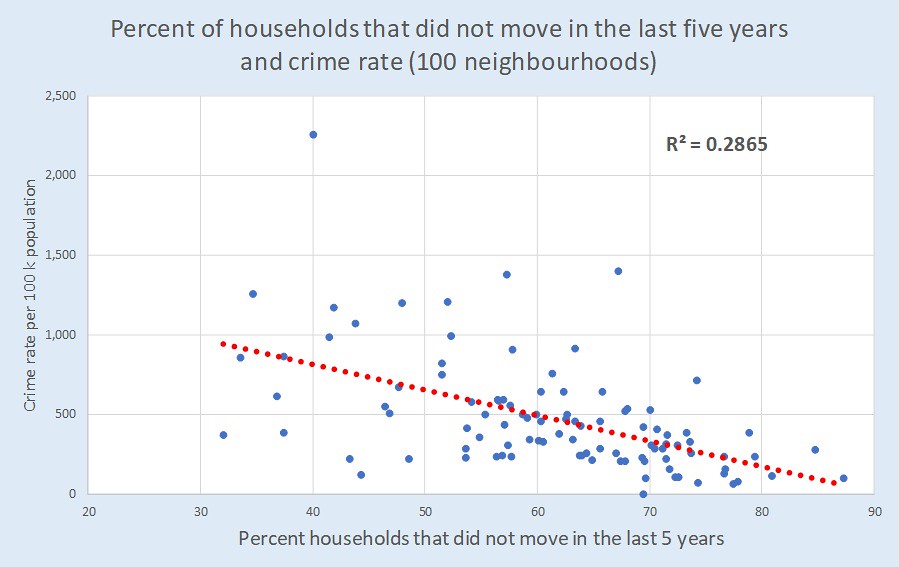
Figure 3. Residency length and crime rate (based on 100 neighbourhoods)
(Data from the Ottawa Neighbourhood Study)
Figure 3 displays a reliable correlation (R2 = 0.2865) between length of tenure and neighbourhood crime rate. It is commonly understood that short tenures undermine casual and, more so, frequent social interaction. They also diminish the likelihood that transient residents will partake in communal activities. Having determined the relative mobility ratio between owners and tenants – around 1/6 at least – we can reasonably surmise that the dominant vector in this correlation would be tenants’ mobility.
Once again, Jacobs’ fear about the “birds of passage” is borne out by the tenure duration statistics. Their move frequency can arguably be added to their income level (i.e. relative poverty) as a factor in neighbourhood crime events. With these two factors at play, we can now venture to quantify the “substantial number” (i.e. the threshold of tenant ratio) past which neighbourhood safety may deteriorate irrevocably. How many tenants are too many?
Tenant ratio threshold
All professional practices that ensure the well-being of city residents use thresholds as indispensable pointers. Codes and manuals are replete with thresholds – maxima, minima, critical and graduated. Such thresholds are normally based on fundamental theory and often verified by experiment. In this case, mainly a social outcome prediction, theory is non-existent and experimentation impossible. Under these constraints, we can only try to tease out a rudimentary threshold from available data (with no illusions about its validity and generality.) The intent of this experiment is simple: to demonstrate that intervention can only be justified on the basis of a quantified threshold.
To arrive at a speculative threshold, we took the average city crime rate as an indicator of acceptable safety; an arbitrary choice but reasonable, given the city’s comparatively high safety level among Canadian CMAs. Other choices, based on a different rationale, could be deemed equally valid, and, upon reflection, adopted.

Figure 4. Determining a renter ratio threshold, based on community crime statistics
(Data: Ottawa Neighbourhood Study -authors calculations)
After dividing the 100 communities into sets according to their percentage of owners, we calculated the crime ratio of each community in every set with respect to the city’s average. We then determined the average of each set. Figure 4 shows three sets, their average ownership rates and their average crime ratios to the city’s average rate. Group 2 displays an average ratio of 1.1, that is a crime rate roughly equal to the city’s average. Absent a more rigorous analysis, we can state, while acknowledging the limitations of this trial, that a minimum 60% ownership rate (i.e. a maximum of 40% renter) would be a likely threshold for reasonable safety in a given community, at least in this sample city. This result quantifies Jacobs’ vague “substantial number”. In this example, over half of the one hundred communities exceed that threshold.
Maintaining a tenant ratio: the challenge
Assuming that a threshold ratio has been established by thorough analysis, two issues arise automatically in existing neighbourhoods: the first is monitoring the ratio; the second, preventing excess rental units from being built - beyond the threshold. Currently, there exists no mandate or mechanism for monitoring such ratios or for enforcing them. How can a neighbourhood avoid an undesirable transformation?
Resisting unwelcome neighbourhood change (e.g. gentrification) inevitably falls in the hands of its existing residents. Jacobs opposed a highway and other “projects” in Manhattan in part because they created a situation “when the neighbourhood becomes them” (i.e. transient tenants) . At this time, any objections based on personal forebodings and opinions alone are automatically suspect, quickly branded NIMBY-ism, and looked upon as snobbish, discriminatory and anti-urban. Worse still, as objections to rental projects naturally stem from long time residents, who, as we saw, are predominately owners, they, as such, fuel disproportionate suspicion and intensify the incriminatory rhetoric.
Here we have the makings of a perfect urban dilemma: protecting one’s neighbourhood is held up as a personal civic duty, a laudable task, but also grounds for vilification and banishment. Jacobs showed a way out of it, but is it the only path?
Conclusion
In earlier posts we suggested that the social fabric of a neighbourhood is a far better predictor of its crime rate than its physical structure. Building on Jacobs’ casual discussion of tenancy in a neighbourhood, we uncovered the potential role of an additional socio-economic characteristic, as yet unrecognized – being a tenant. Jacobs’s apprehension about exceeding an unspecified threshold of tenant ratio in a neighbourhood turns out to be justified. Going beyond this assertion, we calculated such a threshold tentatively only for a given city, while emphasizing the need for developing a reliable method for defining it. This new indicator could help us to assess neighbourhood change on rational grounds and add some new elements to the policy debate.
Fanis Grammenos is the director Urban Pattern Associates in Ottawa, Ontario and the author of Remaking the City Grid: A Model for Urban and Suburban Development. Reach him by email at fanis.grammenos@gmail.com with questions or comments.
Photo: Rebecca Kennison [CC BY-SA 3.0], from Wikimedia Commons


