
Tokyo is the ultimate in urbanization, being nearly one-half larger than any other urban area in the world. Further, Tokyo has retained its position as the largest urban area in the world for longer than any period since London's approximately 100 year run from the early 1800s to the early 1900s. During the 1920s, New York became the largest, but was displaced by Tokyo in 1955.
Tokyo became the world's largest urban area by adding more than 20 million people between 1955 and 2000, adding more people than lived in any other urban area in the world during that period. Even with its now slow growth, Tokyo seems likely to remain number one for two decades or more. However, if the breakneck growth of urban areas like Jakarta, Delhi and Manila continues, Tokyo could relinquish its position by 2030, especially if Tokyo begins losing population, joining Japan in that country’s accelerating rate of population decline as is projected (below).
The Tokyo region is much more than Tokyo proper (the "ku-area"). It includes Yokohama, which with 3.7 million people is larger than any suburb in the world except for Howrah in the Calcutta area. Kawasaki, between Tokyo and Yokohama has a population of 1.4 million, while Saitama, to the north has 1.2 million. Chiba, on the way to Narita International Airport, is home to nearly 1,000,000. There are multiple possible definitions of the Tokyo region. This article defines the Tokyo metropolitan area as Chiba, Kanagawa, Saitama and Tokyo prefectures (Note 1).
Suburban Areas: Tokyo also has the largest suburban population of any metropolitan region in the world. Approximately 26.7 million, or 75 percent of the Tokyo region’s 35.4 million population lives in suburban areas. This is the largest expanse of suburbanization in the world. The suburban population increase since 1950 exceeds that of New York, Los Angeles, and Paris combined (Note 2).
The Core
Tokyo is unique in having abolished its core municipality. In 1943, the former city of Tokyo was combined with the prefecture of Tokyo. This area was also labeled the Tokyo "metropolis." (Note 3) The prefecture of Tokyo contained a number of additional municipalities, which were not impacted by the merger, while the former area of the city of Tokyo was directly administered by the prefecture. In the intervening decades, the former city has been reorganized into 23 wards (ku), which have obtained considerable self-government authority, emerging as the near equivalent of cities themselves.
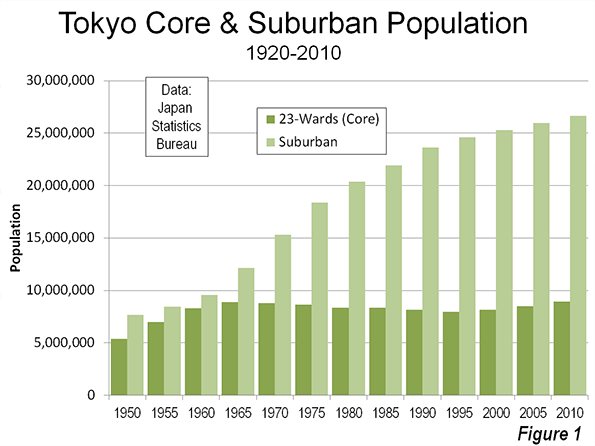
This "ku" area can be considered the historical core municipality. The 23 ku reached a peak population in 1965 of 8.893 million in 1965. In the next 30 years, the 23 ku sustained a population loss of more than 900,000, while the suburban areas were adding more than 20 million. The ku area exceeded its previous peak in the 2010 census, reaching 8.946 million, approximately 50,000 more than in 1965.
Growth Trends:
Census data indicates that in 1940, the core accounted for 53 percent of the region's population. This dropped to 41 percent in 1950, with the largest share of war-time population losses in the ku area. The core gained back to 47 percent of the population in 1960. After that, nearly all growth was in the suburbs. Between 1950 and 2000, 87 percent of the population gain was in the suburbs. In the last decade, the suburbs share of growth dropped to 63 percent (Figure 1 and Table)
| Tokyo Metropolitan Region | |||||||
| Population by Sector: 1920-2010 | |||||||
| Year | Tokyo Region | Former City of Tokyo | Balance of Tokyo Prefecture | Tokyo Prefecture | Kanagawa Prefecture | Saitama Prefecture | Chiba Prefecture |
| 1920 | 7,678,000 | 2,173,000 | 1,526,000 | 3,699,000 | 1,323,000 | 1,320,000 | 1,336,000 |
| 1930 | 9,958,000 | 1,995,000 | 3,414,000 | 5,409,000 | 1,620,000 | 1,459,000 | 1,470,000 |
| 1940 | 12,740,000 | 6,779,000 | 576,000 | 7,355,000 | 2,189,000 | 1,608,000 | 1,588,000 |
| 1950 | 13,051,000 | 5,385,000 | 893,000 | 6,278,000 | 2,488,000 | 2,146,000 | 2,139,000 |
| 1955 | 15,424,000 | 6,969,000 | 1,068,000 | 8,037,000 | 2,919,000 | 2,263,000 | 2,205,000 |
| 1960 | 17,864,000 | 8,310,000 | 1,374,000 | 9,684,000 | 3,443,000 | 2,431,000 | 2,306,000 |
| 1965 | 21,017,000 | 8,893,000 | 1,976,000 | 10,869,000 | 4,431,000 | 3,015,000 | 2,702,000 |
| 1970 | 24,113,000 | 8,787,000 | 2,621,000 | 11,408,000 | 5,472,000 | 3,866,000 | 3,367,000 |
| 1975 | 27,042,000 | 8,647,000 | 3,027,000 | 11,674,000 | 6,398,000 | 4,821,000 | 4,149,000 |
| 1980 | 28,697,000 | 8,349,000 | 3,269,000 | 11,618,000 | 6,924,000 | 5,420,000 | 4,735,000 |
| 1985 | 30,273,000 | 8,354,000 | 3,475,000 | 11,829,000 | 7,432,000 | 5,864,000 | 5,148,000 |
| 1990 | 31,796,000 | 8,164,000 | 3,692,000 | 11,856,000 | 7,980,000 | 6,405,000 | 5,555,000 |
| 1995 | 32,577,000 | 7,968,000 | 3,806,000 | 11,774,000 | 8,246,000 | 6,759,000 | 5,798,000 |
| 2000 | 33,413,000 | 8,130,408 | 3,928,592 | 12,059,000 | 8,490,000 | 6,938,000 | 5,926,000 |
| 2005 | 34,472,000 | 8,490,000 | 4,081,000 | 12,571,000 | 8,791,000 | 7,054,000 | 6,056,000 |
| 2010 | 35,618,000 | 8,946,000 | 4,213,000 | 13,159,000 | 9,048,000 | 7,195,000 | 6,216,000 |
| Data from Census of Japan | |||||||
Generally, however the last decade has been far better for the core than in any period since 1960. Over each of the last two five year census periods, the percentage growth in the core has been greater than that of the suburbs, which, examining data from Europe, United States, Canada, and elsewhere is quite unusual.
Density Comparisons
Tokyo is often portrayed as one of the world's highest density urban areas. It is not. At a density of 11,300 per square mile (4,300 per square kilometer), Tokyo is less dense than London (13,700 & 5,300), one-sixth the density of Hong Kong (67,000 & 25,900) and one-tenth the density of Dhaka (115,000 & 44,400). There are two reasons for this:
- Tokyo does not have intensely dense central areas. The ku area has a density of 37,300 per square kilometer (14,400 per square kilometer). This is well below the densities of Manhattan (69,000 & 27,000) and the ville de Paris (51,000 & 21,000). Only one of the ku (Toshima) exceeds the density of Paris.
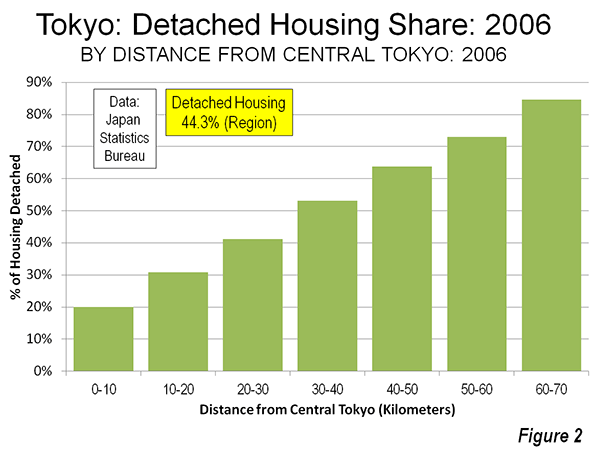
- Further, according to the Japan House and Land Survey of 2008, Tokyo has a large stock of detached houses, by definition lower density. Nearly 45 percent of the Tokyo region's housing is detached. One-third of the dwellings within 30 kilometers (18 miles) of the core are detached. This figure rises to more than 60 percent outside 30 kilometers from the core and 85 percent between 60 and 70 kilometers (37-43 kilometers) from the core (Figure 2).
Transport
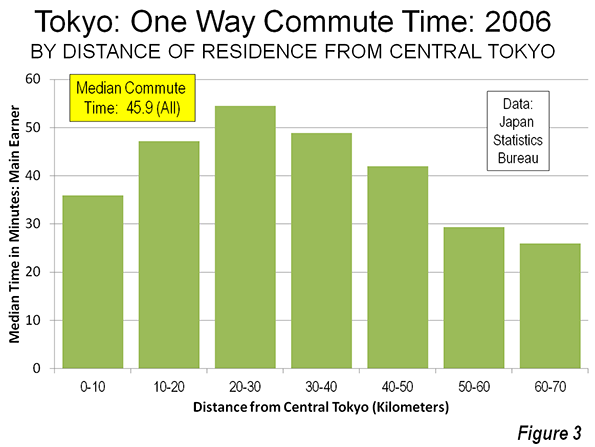
Tokyo is a transit oriented metropolis, with by far the highest transit usage in the world. In 2007, 65 percent of trips within a 50 mile radius were by mass transit. Overall transit usage is (passenger miles or kilometers) in the Tokyo region is approximately double that of all combined usage in the United States and nearly 10 times that of Paris, according to the Millennium Cities Data base. At the same time, one-way work trip travel times are reported to be the highest in the high income world, at a median of 45.9 minutes (Note 4) for main earners. Work trip travel times from residences are the shortest from the most remote residential locations (60-70 kilometers from the core) at a median of 26 minutes and at 29 minutes from residences between 50 and 60 kilometers from the core. Median travel times are 36 minutes one way within 10 kilometers of the core (Figure 3). The longest commutes are from residences located between 10 and 50 kilometers from the core (6 to 31 miles), which peak at 54.5 minutes each way between 20 and 30 kilometers (12 and 18 kilometers) from the core.
Toward a City State?
Japan has been centralizing for decades, principally as rural citizens have moved to the largest metropolitan areas. Since 1950, Tokyo has routinely attracted much more than its proportionate share of population growth. In the last two census periods, all Japan’s growth has been in the Tokyo metropolitan area as national population growth has stagnated. Between 2000 and 2005, the Tokyo region added 1.1 million new residents, while the rest of the nation lost 200,000 residents. The imbalance became even starker between 2005 and 2010, as Tokyo added 1.1 million new residents, while the rest of the nation lost 900,000. (Figure 4)
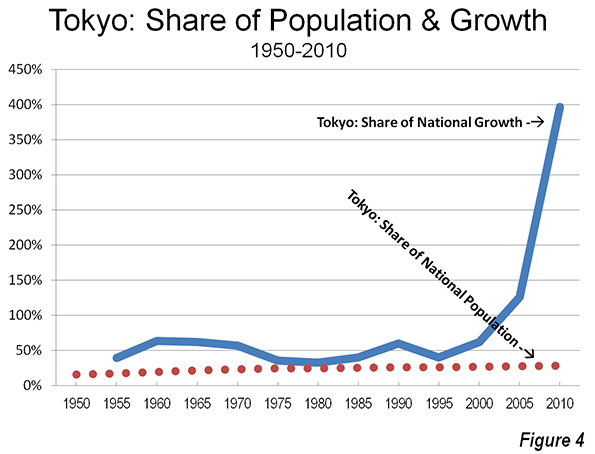
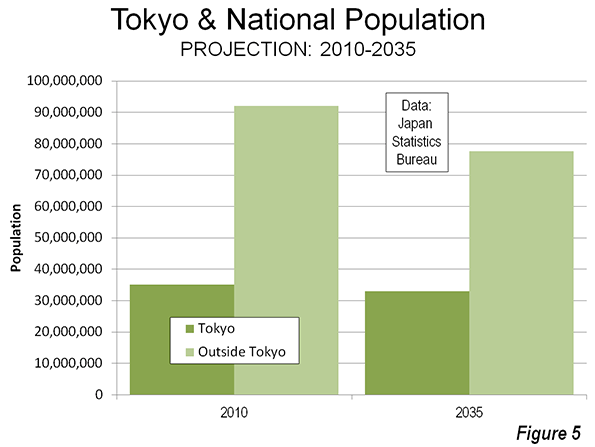
Eventually, Japan’s imploding population will finally impact Tokyo. Population projections indicate that between 2010 and 2035, Tokyo will start losing population. But Tokyo's loss, at 2.1 million, would be a small fraction of the 16.5 million loss projected for the rest of the nation (Figure 5). If that occurs, Tokyo will account for 30 percent of Japan's population, compared to 16 percent in 1950. With Japan's rock-bottom fertility rate, a declining Tokyo will dominate an even larger share of the country’s declining population and economy in the coming decades.
Wendell Cox is a Visiting Professor, Conservatoire National des Arts et Metiers, Paris and the author of “War on the Dream: How Anti-Sprawl Policy Threatens the Quality of Life.”
Photo: Yamanote Loop Train, Tokyo Station (by author)
Note 1: The government defines a Tokyo major metropolitan area, using smaller area data. However, insufficient data is readily available for this article.
Note 2: These three urban areas have the largest suburban populations in the high income world outside Tokyo and Osaka-Kobe Kyoto.
Note 3: The term "Tokyo metropolis," has misled any number of analysts to believe that it means the Tokyo metropolitan area. In fact, it means only the prefecture of Tokyo, which is only one of the from one of the from four to eight prefectures (part or all) that can be considered a part of the metropolitan area, depending on the definition. Thus any comparison of the "Tokyo metropolis" with anything else in metropolitan in the world is best dismissed out of hand.
Note 4: Based on an analysis of the detailed data, it is estimated that the one-way average work trip travel time is more than 48 minutes.


