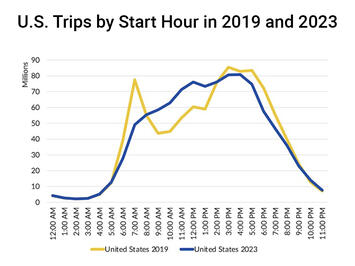
Morning and afternoon rush-hour traffic has returned to pre-pandemic levels in many U.S. urban areas, according to INRIX’s 2023 Global Traffic Scorecard.<--break--> However, what INRIX finds most “astonishing” is that mid-day traffic has grown by an average of 23 percent and is now much greater than during the morning rush hour, and almost as great at around noon as the afternoon rush hour.
This will only be astonishing to people who haven’t read the several research studies finding that people who work at home drive more miles per day than people commute who work. As the above chart indicates, morning rush-hour traffic in U.S. urban areas is down 12 percent while afternoon rush-hour traffic is down 9 percent; but total traffic is up because of the 23 percent increase in mid-day traffic.
Although one of the research studies finding that telecommuters drive more frets that the increased driving will increase greenhouse gas emissions, that isn’t necessarily true. Fuel consumption and greenhouse gas emissions are a function not just of miles of driving but the traffic conditions: less stop-and-go driving means less fuel consumption and emissions. An INRIX study of Atlanta found, for example, that an 8 percent decline in overall in driving resulted in a 15 percent decline in greenhouse gas emissions. This suggests that, contrary to popular belief, building more roads to relieve congestion can be an important way to reduce greenhouse gas emissions.
The INRIX traffic study found that New York had the worst congestion of any urban area in the world in 2023, with the average driver losing 101 hours to delays. This was 11 percent more than in 2019. Hours of delay per driver had also increased by 18 percent in Chicago and Miami, 17 percent in San Antonio, and 12 percent in Dallas.
Remember, however, that not all of those delay hours were during rush hours. It is quite likely that rush-hour traffic remained below pre-pandemic levels in almost all U.S. urban areas, but that decline is partly made up for by delays during mid-day periods.
Even counting mid-day traffic, most U.S. urban areas had significantly less congestion in 2023 than in 2019. Among major urban areas, Baltimore congestion was down 24 percent, Hartford was down 18 percent, Cincinnati down 17 percent Austin down 14 percent, Seattle and Denver both down 11 percent, Washington down 9 percent, Portland down 8 percent, and Los Angeles was down 4 percent.
Out of 290 U.S. urban areas ranked by INRIX, 2023 congestion was worse than in 2019 in 88, was unchanged in 8, and was not as bad in 194. The U.S. experience, where congestion was lower in two-thirds of urban areas, was the opposite of Europe, where two-thirds of urban areas suffered more traffic delays in 2023 than in 2019. That’s probably because European cities have greater concentrations of jobs located in downtowns, where traffic is likely to be worst.
While the average U.S. driver wasted 42 hours in traffic in 2023, that’s way down from 2019 when the average driver lost 99 hours. INRIX estimates the total 2023 cost of congestion to auto drivers was more than $77 billion. INRIX did not estimate the cost to trucking companies, but the American Transportation Research Institute estimated it was almost $95 billion in 2021, and was probably greater in 2023.
New York City’s controversial “congestion pricing” plan, which was really a cordon pricing plan, would not have fixed the problem. The city’s plan called for charging a flat fee to drive into lower Manhattan between 5 am and 9 pm. Planners predicted that this would reduce the number of vehicles entering this zone by 100,000 per day.
There are two reasons why this plan would fail to relieve congestion in the long run. First, while a flat fee would cause a one-time reduction in traffic, it would do nothing about traffic growth over time. London’s cordon pricing significantly reduced traffic at first, but within a few years traffic was back. INRIX rated London as the most congested urban area in the world in 2022 and third-most in 2023.
Read the rest of this piece at The Antiplanner.
Randal O'Toole, the Antiplanner, is a policy analyst with nearly 50 years of experience reviewing transportation and land-use plans and the author of The Best-Laid Plans: How Government Planning Harms Your Quality of Life, Your Pocketbook, and Your Future.
Chart: courtesy The Antiplanner.


