During his 16-year career in the NBA, Rasheed Wallace was among basketball’s most intimidating power forwards. He was also among the most volatile. Wallace holds the single-season record for technical fouls (41) and ranks third all-time in total technicals with 317.
In addition to his disdain for referees, the 6’11” Wallace, gained fame for a particular catchphrase. If “Sheed” or one of his teammates was called for a foul that he thought was undeserved, and the opposing player missed the ensuing free throw, he would often holler, “Ball don’t lie,” to indicate that the basketball knew the referee had made a bad call.
The ball don’t lie. Neither do the numbers in the latest Statistical Review of World Energy.
Amid the ongoing blizzard of propaganda about the “energy transition” and the tired antics of the goobers from Just Stop Oil — a pair of whom vandalized Stonehenge with orange paint last Wednesday — the Statistical Review, published by the Energy Institute, KPMG, and Kearney, provides a much-needed reality check to the narrative being promoted by major media outlets, academics, and the NGO-corporate-industrial-climate complex.
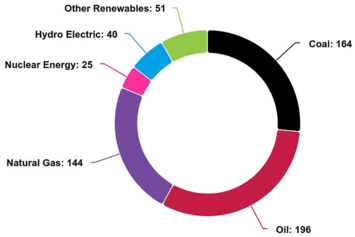
The new Statistical Review, released last Thursday, shows, yet again, that despite the hype, subsidies, and mandates, wind and solar energy aren’t keeping pace with the growth in hydrocarbons. Global hydrocarbon use and CO2 emissions hit record highs in 2023, with hydrocarbon consumption up 1.5% to 504 exajoules (EJ). That increase was “driven by coal, up 1.6%, [and] oil up 2% to above 100 million barrels [per day] for the first time.” Global natural gas demand was flat, mainly due to stunning declines in Europe. Gas demand in the U.K. fell by 10%. It also fell by 11% in Spain, 10% in Italy, and 11% in France.
Soaring electricity demand was, yet again, the big story in 2023. Global power generation increased by 2.5% to 29,924 terawatt-hours. About 32% of that juice (9,456 TWh) was generated in China, where electricity production surged by nearly 7%. The U.S. came in a distant second in power generated, with 4,494 TWh. Domestic power production dropped by about 1% last year. Power generation in India also increased by about 7% last year to a record 1,958 TWh, 75% of which came from coal-fired power plants.
I look forward to the release of the Statistical Review every year because the data can be downloaded in Excel. That allows me and others to make meaningful comparisons beyond the spin. Numerical comparisons are essential ingredients in the debate over energy and climate policy. The best advice I ever got on presenting numbers came from author and statistician Edward Tufte. He said: whenever you give people a number, give them a familiar metric so they can make a comparison. That advice changed the course of my career. Here are nine charts from the Statistical Review.
Read the rest of this piece at Robert Bryce Substack.
Robert Bryce is a Texas-based author, journalist, film producer, and podcaster. His articles have appeared in a myriad of publications including the Wall Street Journal, New York Times, Forbes, Time, Austin Chronicle, and Sydney Morning Herald.
Photo: courtesy Robert Bryce Substack.


