Between 2020 and 2023 (annual population estimates, as of July 1), more than 3.2 million US residents moved from counties with higher urban population densities (number of urban residents divided by urban square miles), to counties with lower urban densities. The net effect is that the counties with lower urban densities gained 6.4 million new residents from domestic migration compared to the counties with higher urban densities (Figure 1).
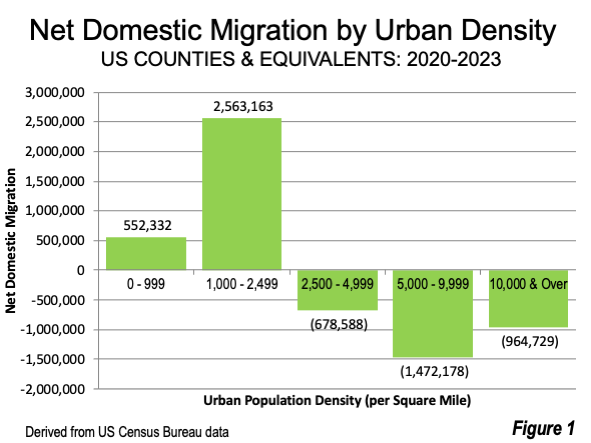
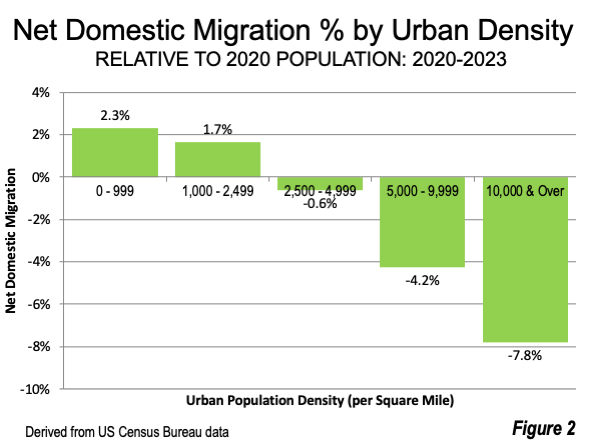
The largest gain was in counties with urban densities of from 1,000 to 2,499 per urban square mile, at 2.56 million net domestic migrants over the three-year period. Altogether, this urban density classification includes 1,574 counties (Figure 3), slightly less than one half of the 3,186 county equivalents (see below).This urban density category includes counties like Mecklenburg, North Carolina (county seat Charlotte), Jackson, Missouri (county seat Kansas City as well as Kaufman County, Texas, with an urban density of 2,007 in 2020. Kaufman County had the strongest net domestic migration in the nation of any county or county equivalent, at 24.1% of its 2020 population. Kaufman County is in the Dallas-Fort Worth metropolitan area, which also saw the highest net domestic migration volume (more than 500,000) in the nation during the 2010s (see lead photo).
The other gaining category was the counties with urban densities of zero to 999 per square urban at 0.52 million. There are 1,385 counties in this grouping. Examples include: Davidson County, North Carolina (county seat Lexington) and Fairbanks-Northstar Borough, Alaska (government: Fairbanks).
The largest loss was in counties with from 5,000 to 9,999 persons per urban square mile, at 1.47 million. This classification includes 21 counties. Examples with similar urban densities include: San Mateo, California (suburban San Francisco), Los Angeles, California, adjacent Orange County, California and Nassau County, New York (suburban adjacent to Queens, New York).
The counties with the highest urban densities (10,000 per urban square mile or more) lost 0.96million net domestic migrants. There are 10 counties in this classification, which include four of the five New York city boroughs (Manhattan, Brooklyn, Queens and the Bronx), San Francisco, Philadelphia, Hudson County, New Jersey (county seat Jersey City), Suffolk County, Massachusetts (county seat Boston) and Washington, DC.
The smallest loss was in counties with from 2,500 to 4,999 persons per urban square mile, with a loss of 680,000. Examples with similar urban densities include King in Washington (county seat Seattle) and Salt Lake, Utah (county seat Salt Lake City).
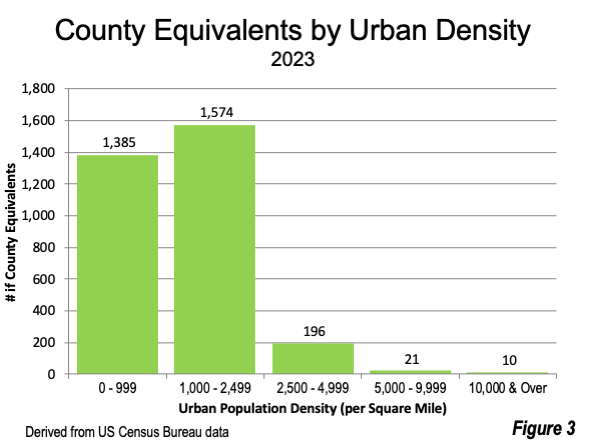
The movement away from urban densities is even more obvious when looking at percentages. The largest percentage gain in net domestic migration was in the smallest urban density classification (Figure 2), from zero to 999 residents per square mile, at 2.3%. The next higher category, 1,000 to 2,499 per urban square mile had the second largest gain, at 1.7%. The next higher urban density category, 2,500 to 4,999 had the smallest loss, at minus 0.6%.In contrast the second densest category (urban density of 5,000 to 9,999 per square mile) had a loss of 4.2%. The largest net domestic migration loss, minus 7.8% was in the densest category (urban density of 10,000 or more).
Exurbanization or Suburbanization? The new data indicates that the greatest percentage growth is in the less dense parts of metropolitan areas and beyond. Rather than mere suburbanization, overwhelming in the nearly 80 years since World War II, the new trend is more like exurbanization.
The remainder of the article provides definitional information.
Urban Population Densities: The Census Bureau designates urban areas, which contain all of the nation’s urban population. Urban areas are composed of census blocks (the lowest enumeration level). Urban areas are constructed from census blocks without regard to any boundaries except international. A number of urban areas stretch over state lines. For example, Philadelphia is not only in Pennsylvania, but also in New Jersey, Delaware and Maryland and Cincinnati is in Ohio, Kentucky and Indiana.
Essentially, urban areas are areas of continuous development and contain no rural areas. As a result, urban areas are different from metropolitan areas (called functional urban areas in Europe), which include urban areas, but far more rural land outside the urban areas.
This is perhaps best illustrated by San Bernardino County, California, which is the nation’s largest county, with approximately 20,000 square miles. This is larger than nine states and many countries (such as Denmark and Slovakia). However, San Bernardino County is smaller than some county equivalents in Alaska, the largest of which (Yukon-Koyukuk Census Area) is six times larger. San Bernardino’s urban density is about 3,500 per square, which is well above the national average of 2,550 per urban square mile. Its rural density is only six persons per square mile.
According to the Census Bureau:
For the 2020 Census, an urban area will comprise a densely settled core of census blocks that meet minimum housing unit density and/or population density requirements. This includes adjacent territory containing non-residential urban land uses. To qualify as an urban area, the territory identified according to criteria must encompass at least 2,000 housing units or have a population of at least 5,000.
The Census Bureau publishes urban and rural population, land area and densities for entire counties, urban areas within the counties and rural areas within the counties. Urban areas now constitute approximately 80 percent of the national population. Urban and rural data is produced every ten years as a part of the US Census.
A previous newgeography.com article details the 83 urban areas that had 500,000 or more population at the 2020 census. Los Angeles retained its title as the densest urban area in the United States, after earlier information was corrected.
County equivalents: County equivalent areas cover the entire land area of the United States. This includes counties in most states, parishes in Louisiana, Census Areas and boroughs in Alaska, independent cities and the District of Columbia.
Domestic Migration: The Census Bureau estimates domestic migration data at the county level. But it is not possible from the data to tell exactly where people move from or to within counties. However, the use of the urban densities can give an indication of the extent of urbanization that characterizing the counties being left and those to which people are moving. Net domestic migration is the total in migration minus the total outmigration from a county. This analysis allocates all domestic migration to the urban parts of counties, which presents the most density favorable outcome. In fact, however, some of the net domestic migration may have been to the rural areas, and the move away from higher densities would be greater.
Wendell Cox is principal of Demographia, an international public policy firm located in the St. Louis metropolitan area. He is a Senior Fellow with the Frontier Centre for Public Policy in Winnipeg and a member of the Advisory Board of the Center for Demographics and Policy at Chapman University in Orange, California. He has served as a visiting professor at the Conservatoire National des Arts et Metiers in Paris. His principal interests are economics, poverty alleviation, demographics, urban policy and transport. He is co-author of the annual Demographia International Housing Affordability Survey and author of Demographia World Urban Areas.
Mayor Tom Bradley appointed him to three terms on the Los Angeles County Transportation Commission (1977-1985) and Speaker of the House Newt Gingrich appointed him to the Amtrak Reform Council, to complete the unexpired term of New Jersey Governor Christine Todd Whitman (1999-2002). He is author of War on the Dream: How Anti-Sprawl Policy Threatens the Quality of Life and Toward More Prosperous Cities: A Framing Essay on Urban Areas, Transport, Planning and the Dimensions of Sustainability.
Lead image: Kaufman County Courthouse, Kaufman Texas. Over the past three years, Kaufman County had the largest net domestic migration percentage of any county or country equivalent geography in the United States. © Larry D. Moore via Wikimedia licensed under CC 4.0.