The 2017 Census Bureau population estimates shows that population growth in the nation’s largest municipalities (incorporated cities and equivalent) has declined substantially relative to the healthier gains posted earlier in the decade. Among the 36 municipalities with more than 500,000 residents (including Honolulu, see below), the total population grew 0.63 percent between 2016 and 2017 (July 1), down more than one-third from the annual rate between the April 1, 2010 census and July 1, 2017. By comparison, the 2017 United States annual growth rate last year was 0.71 percent. The table below summarizes the results.
The United States has approximately 20,000 incorporated municipalities. These are distinguished from metropolitan areas, which are the labor and housing markets that have developed around the largest municipalities. Moreover, there are no national, or even state criteria that produce any sort of conformity in the size of municipalities, so that there can be huge differences in population. The largest municipalities in metropolitan areas can range from under 10 percent of the metropolitan population to more than 60 percent. In Atlanta, for example, the city of Atlanta has just 8.3 percent of the metropolitan area population, while in San Antonio, the city of San Antonio has 61.1 percent of the metropolitan area population.
Fastest Growing Municipalities
Seattle: The city of Seattle has emerged as the decade’s growth leader. Seattle has added 116,000 new residents since the 2010 Census and 17,000 since 2016. The resulting annual growth rates of 2.47 percent and 2.44 percent are the strongest among the municipalities with more than 500,000 population. Seattle accounted for 27 percent of the metropolitan area growth, more than its share of the population, which rose from 17.7 percent in 2010 to 18.7 percent in 2017.
Fort Worth: This second largest city in the Dallas-Fort Worth metroplex placed second in population growth between 2016 and 2017, with an increase rate of 2.18 percent. This is slightly below the 2.23 annual rate achieved since the 2010 Census, which was the fourth largest.
Charlotte: The third fastest growing city was Charlotte, which added 1.84 percent to its population in 2017. However, reflecting the overall rate, Charlotte’s most recent year gain was below its rate since 2010, which was 2.16 percent.
Columbus: The capital of Ohio is emerging as one of the nation’s growth leaders, as was already indicated in the metropolitan area data. Last year, Columbus ranked fourth in growth, at 1.79 percent.
San Antonio: San Antonio was the fifth fastest growing large municipality, adding 1.63 percent in 2017. This was slightly below its 1.81 percent rate since 2010. Reflecting the slower growth among the largest municipalities, this higher growth rate earned a lower ranking, at 7th.
Austin: Austin had been the national growth leader through 2016, but fell behind Seattle in 2017, due to a much slower growth rate. In 2017, Austin’s growth rate was 1.33 percent (ranked 12th), well below its 2.33 percent rate since the Census.
Denver: Denver experienced a trend similar to that of Austin. From 2010 to 2017, Denver added new residents at a rate of 2.25 percent annually. That rate dropped to 1.42 percent in 2017, as Denver was the 9th fastest growing large municipality.
The Largest Municipalities
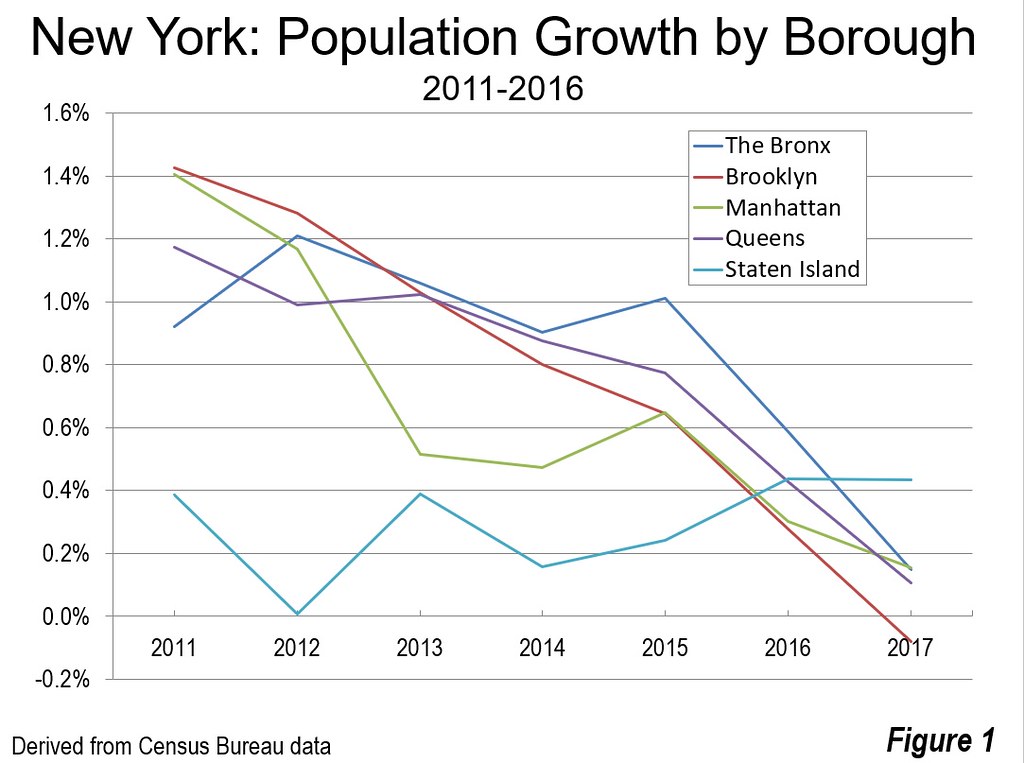
New York: The nation’s largest municipality has seen its strong growth fizzle away. Between 2010 and 2017, New York added residents at a 0.74 percent annual rate, slightly higher than the national rate of 0.69 percent. In 2017, however, New York’s growth plummeted to 0.08 percent, about one-ninth of the national growth rate (0.71 percent). New York’s growth this decade peaked in 2011, when 99,000 residents were added. By 2017, the gain had dipped to 7,000. The four intensely dense urban boroughs experienced huge losses, the greatest in Brooklyn (Kings County), which had a growth rate of 0.77 percent since 2010, but lost population at a rate of 0.08 percent in 2017. The drop in growth rate also exceeded 75 percent in Manhattan (New York County) and 80 percent in The Bronx and Queens. Only Staten Island (Richmond County), with a population density less than that of Los Angeles, grew faster in 2017 than earlier in the decade (Figure 1).
Los Angeles: The second largest municipality has also experienced a substantial loss in growth rate, though not so precipitous as in New York. From the 2010 census to 2017, Los Angeles gained an average of 0.74 percent annually. In 2017, the gain was only 0.47 percent, over one-third less the average post-2010 rate. Further, despite multiple announcements of having reached 4,000,000 residents (see: “Elusive Population Growth in the City of Los Angeles”), the city still remains short (though by only 241). Los Angeles had the fifth largest population growth among the nation’s municipalities (19,000), a strong showing in a slowly growing area. By contrast, the balance of Los Angeles County, with 60 percent of the county population lost 6,000 residents while the metropolitan area’s other county (Orange) grew 13,000, 11,000 of it in the city of Irvine.
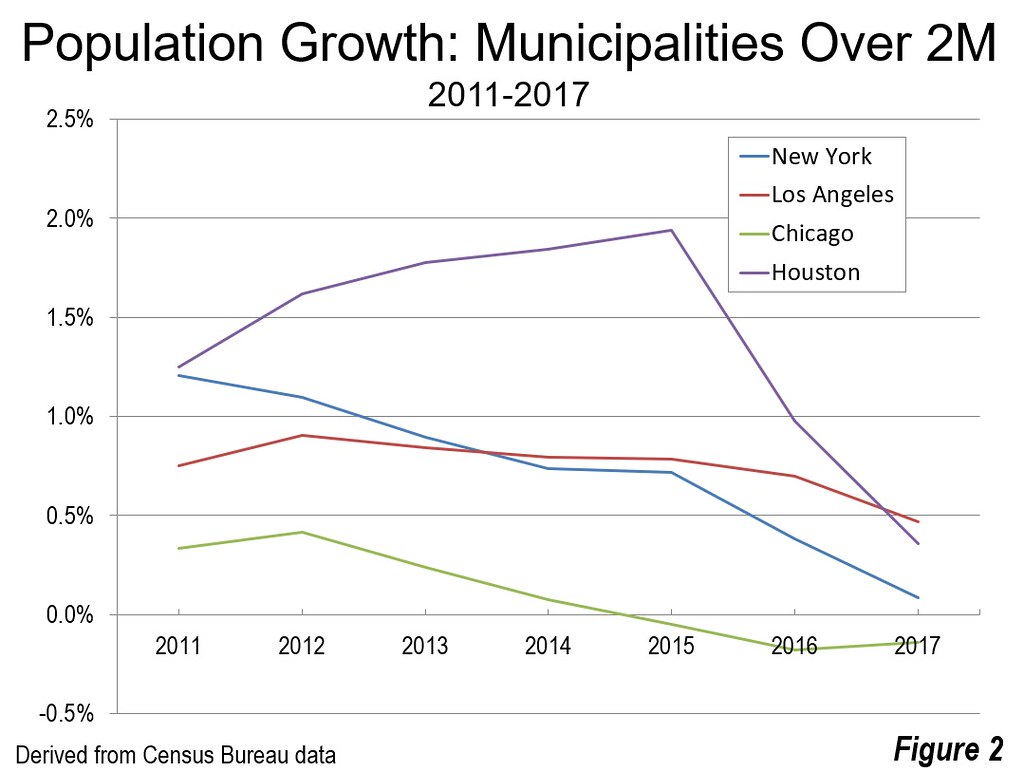
Chicago: Chicago, the third largest municipality extended its recent declines, after modest increases earlier in the decade.
Houston: The fourth largest municipality, Houston, also experienced modest growth, after strong growth earlier in the decade. These data are before the impact of Hurricane Harvey, the immediate population effect of which will be evident in next year’s estimates (Figure 2).
The Special Case of Honolulu
One municipality is missing from the Census Bureau’s list, Honolulu, Hawaii’s capital. Honolulu is an incorporated combined city-county with a population in 2017 of 989,000, the only incorporated general purpose government unit in Hawaii. As a combined city-county, Honolulu is similar to San Francisco, Baltimore, St. Louis, Nashville, Indianapolis, Denver and others. This population should result in Honolulu being ranked as the 10th largest city in the nation, between San Jose and Austin.
Yet, Honolulu is listed in the Census estimates tabulation with a population of 350,000 under the title “Urban Honolulu.” This is due to an agreement between the Census Bureau and the State of Hawaii. In fact, however, Honolulu is the 10th largest city in the United States.
Estimates are Only Estimates
Estimating population (rather than counting it in a Census) is anything but an exact science. This was proven again in 2010, when there were huge over-estimates of population. The population estimate for New York was 200,000 higher in 2009 than counted in the 2010 census. In Detroit, the over-estimate was nearly 200,000. Atlanta, however takes the prize, with an over-estimate of more than 120,000, which was an error of nearly 30 percent. On the whole, however, the population estimates were fairly accurate overall. It will be interesting to see how accurate this decade’s population estimates are in relation to the 2020 Census counts, and what it reveals about the changing fortunes of our largest cities.
| MUNICIPALITIES OVER 500,000 POPULATION IN 2017 | ||||||||
| Population (Millions) | Change | |||||||
| Rank | Municipality | 2010 Census | 2016 | 2017 | 2010-17 | 2016-17 | % 2010-17 | %2016-27 |
| 1 | New York, New York | 8,175 | 8,615 | 8,623 | 448 | 7 | 0.74% | 0.08% |
| 2 | Los Angeles, California | 3,793 | 3,981 | 4,000 | 207 | 19 | 0.74% | 0.47% |
| 3 | Chicago, Illinois | 2,696 | 2,720 | 2,716 | 21 | (4) | 0.11% | -0.14% |
| 4 | Houston, Texas | 2,094 | 2,304 | 2,313 | 218 | 8 | 1.38% | 0.36% |
| 5 | Phoenix, Arizona | 1,447 | 1,602 | 1,626 | 179 | 24 | 1.62% | 1.50% |
| 6 | Philadelphia, Pennsylvania | 1,526 | 1,575 | 1,581 | 55 | 6 | 0.49% | 0.39% |
| 7 | San Antonio, Texas | 1,327 | 1,488 | 1,512 | 185 | 24 | 1.81% | 1.63% |
| 8 | San Diego, California | 1,302 | 1,407 | 1,420 | 118 | 13 | 1.20% | 0.91% |
| 9 | Dallas, Texas | 1,198 | 1,322 | 1,341 | 143 | 19 | 1.57% | 1.43% |
| (*10) | Honolulu, Hawaii | 953 | 993 | 989 | 35 | (4) | 0.50% | -0.41% |
| 10 | San Jose, California | 953 | 1,032 | 1,035 | 83 | 3 | 1.16% | 0.33% |
| 11 | Austin, Texas | 802 | 938 | 951 | 149 | 13 | 2.37% | 1.33% |
| 12 | Jacksonville, Florida | 822 | 881 | 892 | 70 | 11 | 1.14% | 1.27% |
| 13 | San Francisco, California | 805 | 876 | 884 | 79 | 8 | 1.30% | 0.94% |
| 14 | Columbus, Ohio | 789 | 864 | 879 | 90 | 15 | 1.51% | 1.79% |
| 15 | Fort Worth, Texas | 745 | 856 | 874 | 129 | 19 | 2.23% | 2.18% |
| 16 | Indianapolis, Indiana | 820 | 857 | 863 | 43 | 6 | 0.70% | 0.65% |
| 17 | Charlotte, North Carolina | 736 | 843 | 859 | 123 | 16 | 2.16% | 1.84% |
| 18 | Seattle, Washington | 609 | 707 | 725 | 116 | 17 | 2.44% | 2.47% |
| 19 | Denver, Colorado | 600 | 695 | 705 | 105 | 10 | 2.25% | 1.42% |
| 20 | Washington, District of Columbia | 602 | 684 | 694 | 92 | 10 | 1.99% | 1.41% |
| 21 | Boston, Massachusetts | 618 | 678 | 685 | 67 | 7 | 1.44% | 0.98% |
| 22 | El Paso, Texas | 648 | 681 | 684 | 35 | 3 | 0.73% | 0.41% |
| 23 | Detroit, Michigan | 714 | 675 | 673 | (41) | (2) | -0.81% | -0.35% |
| 24 | Nashville, Tennessee | 603 | 665 | 668 | 64 | 3 | 1.40% | 0.42% |
| 25 | Memphis, Tennessee | 652 | 653 | 652 | 0 | (1) | 0.01% | -0.17% |
| 26 | Portland, Oregon | 584 | 641 | 648 | 64 | 6 | 1.45% | 0.98% |
| 27 | Oklahoma City, Oklahoma | 580 | 639 | 644 | 63 | 4 | 1.44% | 0.70% |
| 28 | Las Vegas, Nevada | 585 | 632 | 642 | 57 | 10 | 1.29% | 1.58% |
| 29 | Louisville, Kentucky | 596 | 618 | 621 | 25 | 3 | 0.57% | 0.54% |
| 30 | Baltimore, Maryland | 621 | 617 | 612 | (9) | (5) | -0.21% | -0.86% |
| 31 | Milwaukee, Wisconsin | 595 | 598 | 595 | 1 | (2) | 0.01% | -0.36% |
| 32 | Albuquerque, New Mexico | 546 | 558 | 559 | 12 | 1 | 0.31% | 0.19% |
| 33 | Tucson, Arizona | 523 | 532 | 536 | 12 | 4 | 0.32% | 0.78% |
| 34 | Fresno, California | 497 | 523 | 527 | 30 | 5 | 0.82% | 0.89% |
| 35 | Sacramento, California | 466 | 495 | 502 | 36 | 7 | 1.02% | 1.42% |
| Total (Including Honolulu) | 41,622 | 44,446 | 44,728 | 3,106 | 282 | 1.00% | 0.63% | |
| (*) See note in text on Honolulu | ||||||||
Wendell Cox is principal of Demographia, an international public policy and demographics firm. He is a Senior Fellow of the Center for Opportunity Urbanism (US), Senior Fellow for Housing Affordability and Municipal Policy for the Frontier Centre for Public Policy (Canada), and a member of the Board of Advisors of the Center for Demographics and Policy at Chapman University (California). He is co-author of the "Demographia International Housing Affordability Survey" and author of "Demographia World Urban Areas" and "War on the Dream: How Anti-Sprawl Policy Threatens the Quality of Life." He was appointed to three terms on the Los Angeles County Transportation Commission, where he served with the leading city and county leadership as the only non-elected member. He served as a visiting professor at the Conservatoire National des Arts et Metiers, a national university in Paris.
Photograph: Honolulu: 10th largest city in the United States (by author)