Around the world planners are seeking to increase urban densities, at least in part because of the belief that this will materially reduce automobile use and encourage people to give up their cars and switch to transit, or walk or cycle (Note 1). Yet research indicates only a marginal connection between higher densities and reduced car use. Never mind that the imperative for trying to force people out of their cars has rendered largely unnecessary by fuel economy improvements projected to radically reduce greenhouse gas emissions from cars (see Obama Fuel Economy Rules Trump Smart Growth).
Transit Use and Density: A Tenuous Connection at Best
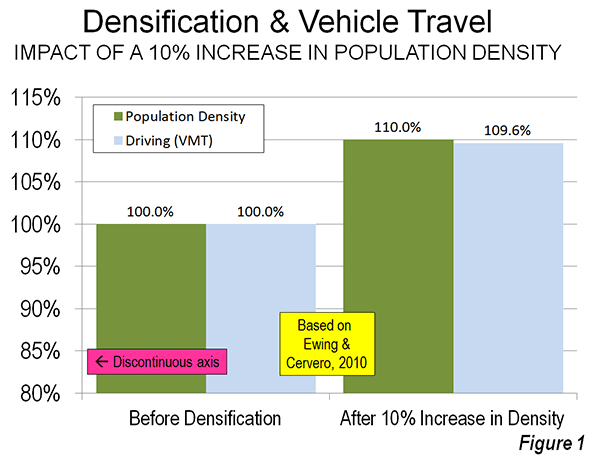
In a widely cited study, Reid Ewing of the University of Utah, and UC Berkeley’s Robert Cervero reported only a minimal relationship between higher density and less driving per capita. In a meta-analysis of nine studies that examined the relationship between higher density and per household or per capita car travel, they found that for each 1 percent higher density, there is only 0.04 percent less vehicle travel per household (or per capita). This would mean that a 10 percent higher density should be associated with a reduction of 0.4 percent in per capita or household driving.
More people in the same area driving a little less means overall driving is greater, as Peter Gordon reminds us. This is illustrated by the Ewing-Cervero finding --- a 10 percent increase in population density is associated with 9.6 percent increase in overall driving, as is indicated in Figure 1 (the calculation is shown in the table). Ewing and Cervero placed this appropriate caution in their research: "we find population and job densities to be only weakly associated with travel behavior once these other variables are controlled."
There is another limitation to the density-transit research. The comparison of travel behaviors between areas of differing density provides no evidence that conversion of an area from lower to higher density would replicate the travel behavior of already existing (historic) areas of higher density.
Transit is about Downtown, Not Density
Ewing and Cervero also found that proximity to the central business district (downtown) is far more likely to reduce vehicle travel than higher densities. This mirrors the findings of others. The Ewing-Cervero conclusion is that, all things being equal, there is a 0.22 percent reduction in travel per capita for each one percent reduction in the distance to downtown.
| Table | |||
| Density and Driving Example | |||
| Base Density | 1% Higher Density | 10% Higher Density | |
| Households | 100 | 101 | 110 |
| Change from Base Density | 1.0% | 10.0% | |
| Daily Driving per Household (Miles) | 10 | 9.996 | 9.960 |
| Change from Base Density | -0.04% | -0.40% | |
| Total Daily Driving (Miles) | 1,000 | 1,009.6 | 1,095.6 |
| Change from Base Density | 0.96% | 9.56% | |
| Based on Ewing & Cervero (2010) |
Transit commuting is strongly concentrated toward the largest downtown areas, which is the only place automobile-competitive mobility can be provided from large parts of the modern metropolitan area (whether in North America, Western Europe or Australasia).
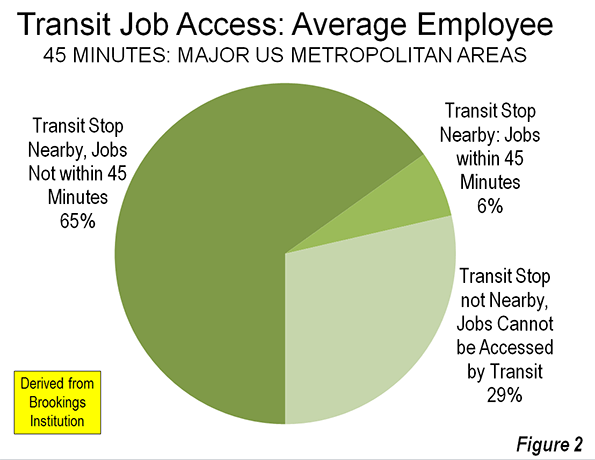
This is, at least in part, why transit service provides such minimal employment access throughout major US metropolitan areas. Data from the Brookings Institution indicates that among the 51 metropolitan areas with more than 1,000,000 population, the average worker can reach only six percent of jobs in 45 minutes (see: Transit: The 4 Percent Solution). Nearly two-thirds of the jobs cannot be reached in 45 minutes, despite transit’s being nearby, while slightly less than one third of workers are not nearby transit at all (Figure 2). By comparison, the average driver reaches work in approximately 25 minutes.
Of course, not everyone can (or would want to) live near downtown. Hong Kong comes closest to this urban containment ideal, with the highest population density of any major urban area in the high income world (67,600 per square mile or 26,100 per square kilometer).Yet despite these extraordinary densities, one-way work trip travel times average 46 minutes, 20 minutes longer than in lower density, similar sized Dallas-Fort Worth.
High Density Commuting in the United States
The centrality of downtown to transit ridership was a principal point of my “transit legacy city” research, which found that 55 percent of all transit commuting in the United States was to just six municipalities (not metropolitan areas). These include the municipalities of New York, Chicago, Philadelphia, San Francisco, Boston and Washington. Among the 55 percent of transit commuters in the nation who work in these six municipalities, 60 percent work in the downtown areas, which are the largest and most concentrated in the nation. This, combined with nearby high density neighborhoods, makes for transit Nirvana.
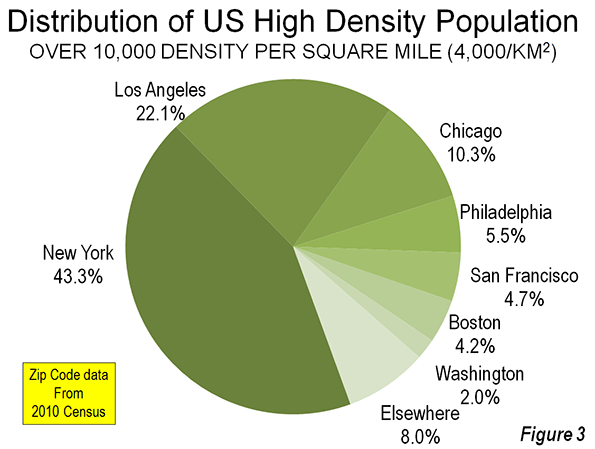
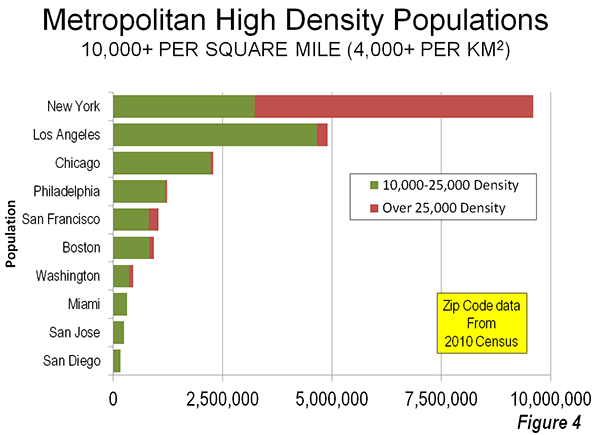
The highest population densities are concentrated in just a few metropolitan areas (Note 2). Approximately 43 percent of the nation’s population living at or above 10,000 per square mile density (approximately 4000 per square kilometer) lives in the New York metropolitan area. Despite its low density reputation, Los Angeles has the second largest concentration of densities above 10,000 per square mile, at 22 percent. Chicago's high density zip codes contain a much smaller 10 percent of the national high density population (Note 3), while nearly all of the balance is in Boston, San Francisco, Philadelphia, and Washington (Figure 3).
The greatest concentration of the highest densities is in New York, which has 88 percent of the national population living at more than 25,000 per square mile (approximately 10,000 per square kilometer). Los Angeles ranked second at 3.5 percent and San Francisco ranks third at 3.2 percent (Figure 4). At this very high population density, nearly 60 percent of New York resident workers use transit to get to work. No one, however, rationally believes that densities approximating anything 25,000 per square mile or above will occur, no matter how radical urban plans become.
An examination of transit work trip market shares in the density range of 10,000 per square mile to 25,000 per square mile illustrates the importance of proximity to downtown. There are nine metropolitan areas in the United States that have more than 200,000 residents living in zip codes with this density. These include the metropolitan areas with the six transit legacy cities, as well as Los Angeles, Miami and San Jose. These latter three experienced from two-thirds to 90 percent of their urban growth since World War II.
San Jose’s large high density population is surprising, because it has a post-War suburban core city and, as a result, a comparatively weak downtown area. Moreover, San Jose has nearly 20 times as many people living at high densities as larger Portland, despite its more than three decades of densification policy (Note 4).
Transit market shares are by far the highest in the high density zip codes of the metropolitan areas with the six transit legacy cities, at 30 percent. This ranges from 27 percent in Chicago to 33 percent in New York and Washington. At first glance, this would be evidence of a fairly consistent transit market share for high densities among the six metropolitan areas (Note 5).
However, metropolitan areas containing the transit legacy cities are unique. Their high density areas are located near their large downtown areas (which are the largest and most concentrated employment centers in the nation), as is to be expected from urban forms that date from the 19th and early 20th centuries. The more recent urban forms of the metropolitan areas rounding out the top ten in high density residents, Los Angeles, Miami, San Jose and San Diego, are very different. Not only do they have smaller downtowns but their high density areas are not concentrated to the same degree around downtown. As a result, their high density transit work trip market shares are much lower (Figure 5).
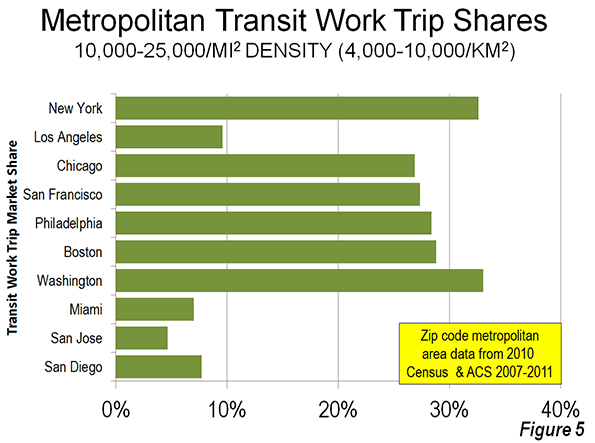
This is best illustrated by Los Angeles, the metropolitan area with the largest number of people living at 10,000 to 25,000 residents per square mile in the nation. The transit work trip market share of these high density zip code residents is 9.6 percent, one-third that of similarly high densities in the metropolitan areas with transit legacy cities.
In Miami, the transit work trip market share of high density residents is only 7.0 percent. In San Jose, the transit work trip market share for high density residents is only 4.6 percent, less than one-sixth that of the metropolitan areas with legacy cities. San Jose’s high density transit work trip market share is even below the national average for all densities (5.0 percent). San Diego’s high density transit work trip market share is 7.7 percent.
“A Negligible Impact”
The transit-density disconnect may have been best summarized by Paul Shimik in 2007 research published in the Transportation Research Record: "The effect of density is so small that even a relatively large-scale shift to urban densities would have a negligible impact on total vehicle travel."
Wendell Cox is a Visiting Professor, Conservatoire National des Arts et Metiers, Paris and the author of “War on the Dream: How Anti-Sprawl Policy Threatens the Quality of Life.
-----
Note 1: This article is limited to the potential for transferring automobile demand from cars to transit. Walking and cycling have only marginal potential for reducing vehicle travel, because these modes cannot provide access throughout today’s large metropolitan (labor) markets.
Note 2: This analysis uses zip code level data from the 2010 Census and the American Community Survey for 2007-2011.
Note 3: Los Angeles also has the second highest share of its population living at densities of 10,000 per square mile and above, at 38 percent. New York has 49 percent at this density, while in Chicago and San Francisco, 24 percent of residents live at these high densities.
Note 4: Portland ranked 25th in high density (at or above 10,000 per square mile) out of the 51 metropolitan areas with more than 1,000,000 population in 2010. Portland’s high density share of its metropolitan population, at 0.7 percent, is well below that of the nation’s most market oriented development metropolitan area, Houston, at 2.0 percent and slightly below that of Dallas-Fort Worth.
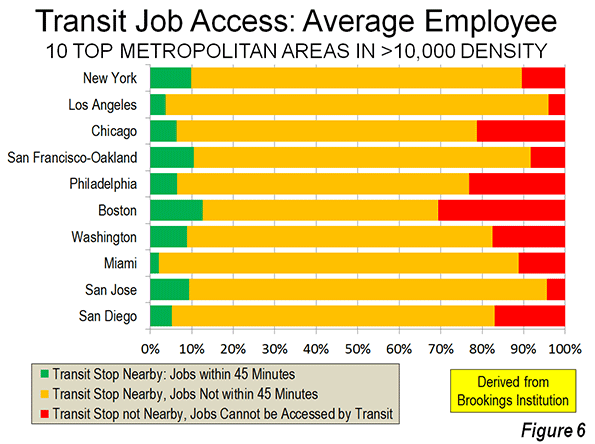
Note 5: Despite their much higher transit work trip market shares in high density areas, the jobs in suburban areas in the metropolitan areas with legacy cities can be as inaccessible by transit as in the metropolitan areas with post-War core municipalities. See Figure 6.
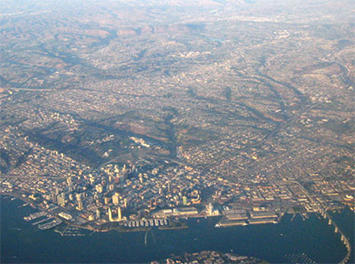
Photo: San Diego (by author)


This is very educational
This is very educational content and written well for a change. It's nice to see that some people still understand how to write a quality post!
take a look here
Pretty good post. I just
Pretty good post. I just stumbled upon your blog and wanted to say that I have really enjoyed reading your blog posts. Any way I'll be subscribing to your feed and I hope you post again soon. Big thanks for the useful info.
how to turn a woman on sexually video
That is really nice to hear.
That is really nice to hear. thank you for the update and good luck.
women want you to make a move
Its a great pleasure reading
Its a great pleasure reading your post.Its full of information I am looking for and I love to post a comment that "The content of your post is awesome" Great work.
michael fiore text your ex back free pdf download
I found your this post while
I found your this post while searching for information about blog-related research ... It's a good post .. keep posting and updating information.
Edward Bass New York
What a fantabulous post this
What a fantabulous post this has been. Never seen this kind of useful post. I am grateful to you and expect more number of posts like these. Thank you very much.
i like her but she's out of my league
I'm glad I found this web
I'm glad I found this web site, I couldn't find any knowledge on this matter prior to.Also operate a site and if you are ever interested in doing some visitor writing for me if possible feel free to let me know, im always look for people to check out my web site.
schoenen werk
This is really a nice and
This is really a nice and informative, containing all information and also has a great impact on the new technology. Thanks for sharing it
amacro
This is such a great
This is such a great resource that you are providing and you give it away for free. I love seeing websites that understand the value of providing a quality resource for free. It is the old what goes around comes around routine.
weiter zur nächsten Seite
Its a great pleasure reading
Its a great pleasure reading your post.Its full of information I am looking for and I love to post a comment that "The content of your post is awesome" Great work.
best way to get the results you want